In the spring of 2026, the memory industry hit an extreme scenario: DRAM contract prices surged 90–95% in a single quarter.
This wasn't a supply-chain disruption or a natural disaster. It was the result of AI data centers consuming every last bit of global high-end memory capacity.
The industry coined a name for this scenario: RAMageddon—RAM + Armageddon.
SK Hynix's Q1 2026 earnings distilled the full force of this storm: revenue of ₩52.6 trillion (~$36 billion), +198% YoY, operating margin of 72%—surpassing both NVIDIA and TSMC. Market cap broke $1 trillion for the first time, up 235% year-to-date.
On the other side, SanDisk—spun out from Western Digital,saw its stock climb from a 52-week low of $36 to $1,590. A 4,400% gain in one year. NAND Flash data center revenue grew 645% YoY, and gross margins vaulted from 22.5% to 78.4%.
The storage industry is notorious for brutal cyclicality,what skyrockets eventually crashes. But this time, one question looms: is AI demand large enough to break the cycle?
- How much memory and storage does AI actually consume? What does the demand structure really look like?
- Who is making real money? HBM, DRAM, NAND, CXL,which layer has the fattest margins and deepest moats?
- Supercycle or superbubble? Under what conditions would this thesis be wrong?
I. Demand Side: AI's Memory Consumption Structure
1.1 GPUs Aren't the Bottleneck,Memory Is
A single NVIDIA Rubin GPU packs 288GB of HBM4 with approximately 22 TB/s of bandwidth (per NVIDIA's GTC 2026 announcement). This is the current ceiling for single-chip memory bandwidth,for comparison, the previous-generation Hopper H100 had 3.35 TB/s of HBM3 bandwidth; Rubin delivers 6.5× that.
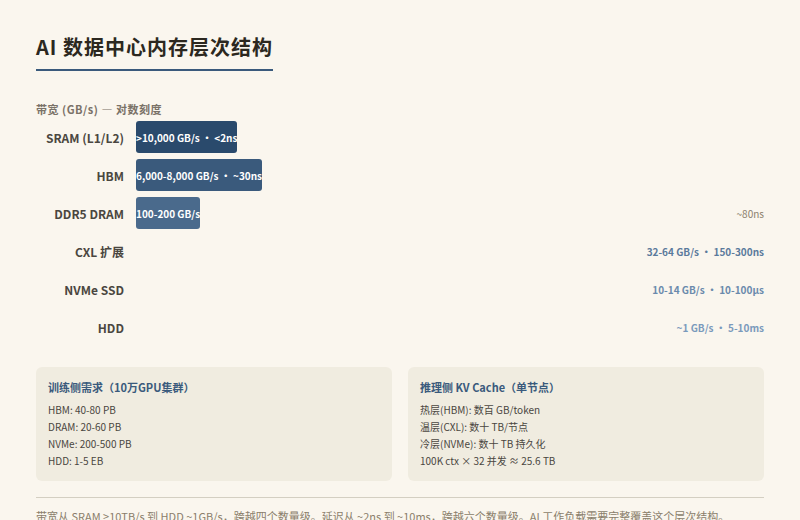
But HBM is just the tip of the AI memory demand iceberg. The full memory hierarchy of an AI data center looks like this:
| Tier | Medium | Capacity/Node | Bandwidth | Latency | Use Case |
|---|---|---|---|---|---|
| L1/L2 Cache | SRAM (on-die) | Tens of MB | >10 TB/s | <2 ns | Hot weights, activations |
| HBM | 3D-stacked DRAM | 288 GB/GPU | ~22 TB/s | ~30 ns | Model weights, KV Cache hot tier |
| DDR5 DRAM | Server memory | 1–4 TB/server | 100–200 GB/s | ~80 ns | Inference batch buffers, RAG indexes |
| CXL memory | DDR5/CXL | Elastic scaling | 32–64 GB/s | ~150–300 ns | Memory pooling, KV Cache warm tier |
| NVMe SSD | NAND Flash | Tens of TB/server | 10–14 GB/s | ~10–100 μs | Training checkpoints, KV Cache cold tier, datasets |
| HDD | Magnetic disk | Hundreds of TB/node | ~1 GB/s | ~5–10 ms | Archival, training data source |
Key numbers: A large AI training cluster (e.g., 100K GPUs) running a GPT-5-scale training job requires roughly:
- HBM: ~40–80 PB (depending on model size and parallelism strategy)
- Server DRAM: ~20–60 PB (data preprocessing, communication buffers)
- NVMe SSD: ~200–500 PB (checkpoints every 15–30 minutes at hundreds of TB each; training datasets at tens of PB)
- HDD archival: ~1–5 EB (training data lifecycle management)
1.2 The Inference-Side Memory Explosion
Training is one-off; inference is perpetual. Two characteristics of inference memory pressure are easy to underestimate:
KV Cache memory consumption. During LLM inference, every token requires storing Key and Value vectors. Take Llama 4 Maverick (400B MoE, 128 layers) with FP8-quantized KV cache:
- KV cache per token ≈ 128 layers × 2 (K+V) × 256 heads × 128 dim × 1 byte (FP8) ≈ 8 MB/token
- A 100K-context request ≈ 800 GB KV cache
- A single inference node serving 32 concurrent requests ≈ 25.6 TB
This means: KV cache alone on a single node can consume tens of TB of memory. It can't all live in HBM. In practice, KV cache is split into hot/warm/cold tiers:
- Hot (most recent N tokens): HBM, latency <30 ns
- Warm (distant context): DDR5/CXL, latency 80–300 ns
- Cold (historical sessions): NVMe SSD, latency 10–100 μs
This is why AI inference doesn't just consume HBM,it simultaneously demands DRAM, CXL expansion memory, and NVMe SSD. The storage requirement isn't a "GPU accessory",it's a complete hot-to-cold hierarchy.
1.3 The Training Checkpoint Storage Storm
Large model training performs a checkpoint every 15–30 minutes,writing model state to persistent storage to prevent starting from scratch after hardware failures.
Take a 10T-parameter model training run:
- Single checkpoint size ≈ 20 TB (parameters + optimizer states, FP16 + FP32 copies)
- Every 15 minutes → 80 TB/hour of writes
- 24 hours → 1.92 PB
- One training cycle (assume 60 days) → ~115 PB of checkpoint writes
These writes must complete quickly (typically <5 minutes), or training efficiency suffers. This means the storage system must sustain burst write bandwidth exceeding 80 GB/s, and the data must be persistent,NVMe SSD is the only option.
II. Supply Side: Who's Making Real Money
HBM (High Bandwidth Memory) is the core component of AI GPUs,and the most profitable segment in the memory industry today.
Market landscape: Only three companies worldwide can produce HBM,SK Hynix, Samsung, and Micron. SK Hynix commands approximately 60–70% market share, particularly across NVIDIA's high-end product lines.
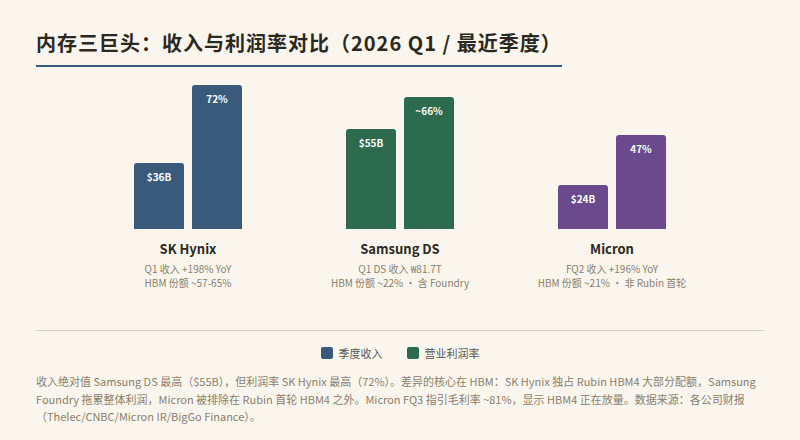
Profitability comparison (Q1 2026):
| Company | Revenue | YoY | Operating Margin | HBM Share |
|---|---|---|---|---|
| SK Hynix | ₩52.6T (~$36B) | +198% | 72% | ~57-65% |
| Samsung DS | ₩81.7T (~$55B) | +69% (overall) | ~66% | ~22% |
| Micron (FQ2) | $23.86B | +196% | 47% | ~21% |
Several numbers stand out:
- SK Hynix's 72% operating margin exceeded NVIDIA's in the same quarter. This reflects HBM capacity scarcity combined with NVIDIA's long-term supply contracts. SK Hynix secured 60-70% of Rubin's HBM4 allocation.
- Samsung DS had the highest absolute revenue (~$55B) but lower margins than SK Hynix. Samsung's DS division includes Foundry, which drags down overall profitability. Samsung's HBM4 DRAM yield remains below 60% (mass production threshold: 70%), slowing its catch-up.
- Micron had the highest revenue growth (+196%) but the lowest margin (47%). Micron was excluded from Rubin's first HBM4 supply cycle,its HBM4 validation lagged, so high-margin HBM revenue is a smaller share. Micron's FQ3 guidance projects gross margin of ~81%, indicating HBM4 is ramping.
Sources: Samsung Q1 2026 earnings (Thelec/CNBC/DCD cross-verified), Micron FQ2 FY2026 earnings (Micron IR/Yahoo Finance), SK Hynix Q1 2026 earnings (multiple sources).
Where's the capacity bottleneck? Not in wafer fabrication, but in packaging. HBM requires TSMC's CoWoS (Chip on Wafer on Substrate) advanced packaging. TSMC's CoWoS capacity continues to expand, but HBM yield rates and stacking layers (from 8 to 16 layers) keep pushing packaging difficulty higher. SK Hynix invested ₩19 trillion in 2026 to build the new M15X fab, dedicated to advanced DRAM and HBM production.
Durability of the moat: HBM's moat comes from three pillars,manufacturing technology (TSV through-silicon vias + 3D stacking), packaging capacity (tied to TSMC CoWoS), and customer relationships (NVIDIA's long-term agreements lock up most of SK Hynix's capacity). These three pillars are difficult to disrupt within 2–3 years.
2.2 DRAM: The Pass-Through Effect of Price Increases
HBM capacity has cannibalized standard DRAM wafer allocation. The three suppliers redirected significant capacity to HBM in 2025–2026, tightening standard DDR5 server DRAM supply.
Price data:
- Q1 2026 DRAM contract prices up 90–95% QoQ (TrendForce)
- Q2 2026 expected to rise another 58–63%
- 2025 total DRAM revenue $165.7 billion, +73% YoY
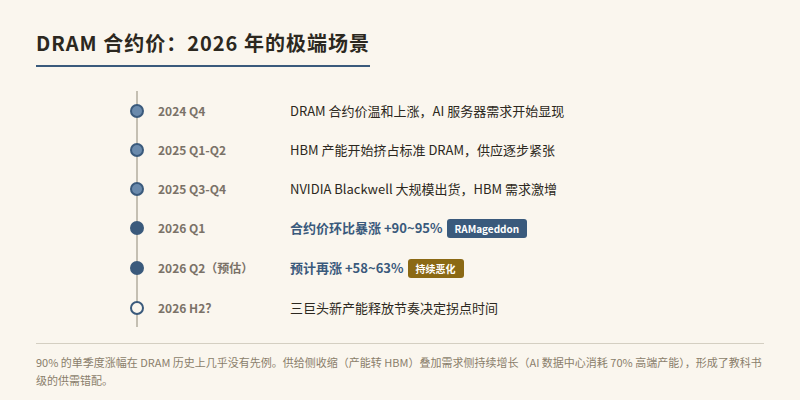
A 90% single-quarter increase has virtually no precedent in DRAM history. The closest parallel was the 2017 cryptocurrency mining boom, but that was a demand-side pulse. This time, it's a supply-side structural contraction (capacity redirected to HBM) compounded by sustained demand-side growth (AI data centers consuming 70% of high-end memory capacity in 2026).
Who gets hurt? Traditional server, PC, and smartphone vendors. Their DRAM costs doubled, but end products can't raise prices in lockstep. This is a zero-sum game,AI data center gains come partly at the expense of non-AI segments.
2.3 NAND Flash: SanDisk's Rebirth
If HBM is a precision weapon, NAND Flash is the commodity of the storage industry. But AI has reshaped NAND's demand structure.
What SanDisk's numbers reveal (Q3 FY2026 actuals):
- Total revenue $5.95B, +251% YoY, exceeding the top of guidance ($4.8B) by $1.15B
- Data center revenue $1.47B, +233% QoQ, +645% YoY
- Non-GAAP gross margin: 78.4% (actual), up from 22.5% a year ago. Prior Q3 guidance was 65-67%; actuals far exceeded it
- Non-GAAP EPS $23.41, far exceeding guidance of $12-14
- Multi-year supply contract backlog of $42 billion
- Stock price from $36 to ~$1,600 in one year, market cap $237B+
Sources: SanDisk Q3 FY2026 earnings (TradingKey/Motley Fool/Yahoo Finance cross-verified).
The leap from 22.5% to 78.4% gross margin reflects two fundamental shifts:
- AI training and inference made NVMe SSD a "must-have" instead of "nice-to-have." Checkpoint storage, KV Cache cold tier, high-speed training data reads,these scenarios demand enterprise-grade NVMe SSD with high capacity and endurance, not consumer products.
- Supply swung from glut to shortage. The NAND industry endured brutal overcapacity in 2023–2024, forcing suppliers to cut production. When AI demand surged, capacity couldn't ramp fast enough.
NAND Top 5 Q1 2026 revenue grew 83.7% QoQ (TrendForce),another extreme data point in NAND history.
2.4 CXL: Still Waiting for the Wind
CXL (Compute Express Link) is the new standard for server memory expansion, theoretically allowing multiple servers to share a memory pool.
Technical status:
- CXL 2.0 supports memory pooling (multi-host access to independent partitions)
- CXL 3.0 supports true memory sharing (multi-host concurrent access to the same segment)
- CXL 4.0 (released November 2025) doubles bandwidth, with x16 link bidirectional up to 1.536 TB/s
- Latest Intel/AMD server CPUs integrate CXL controllers
Actual deployment:
- Microsoft announced the industry's first CXL cloud instance in November 2025, and published the NSDI paper "Octopus" in April 2026 describing its CXL memory pooling topology
- AWS and Google have no public CXL production instances yet
- CXL memory module market ~$2.8B in 2025, projected $28.6B by 2034 (CAGR 29.4%)
Core issue: CXL latency (~150–300 ns) is 2–4× that of local DRAM (~80 ns). For latency-sensitive AI inference (e.g., KV Cache hot tier), this gap is unacceptable. CXL's value lies in capacity expansion, not performance improvement,it's suited for data that's "not hot enough for HBM but too warm to write to SSD."
My judgment: CXL remains a niche configuration in 2026–2027, primarily targeting memory-intensive workloads (large RAG indexes, vector databases, in-memory analytics). It won't become a core AI infrastructure bottleneck like HBM, but it will steadily eat into traditional DRAM's incremental space.
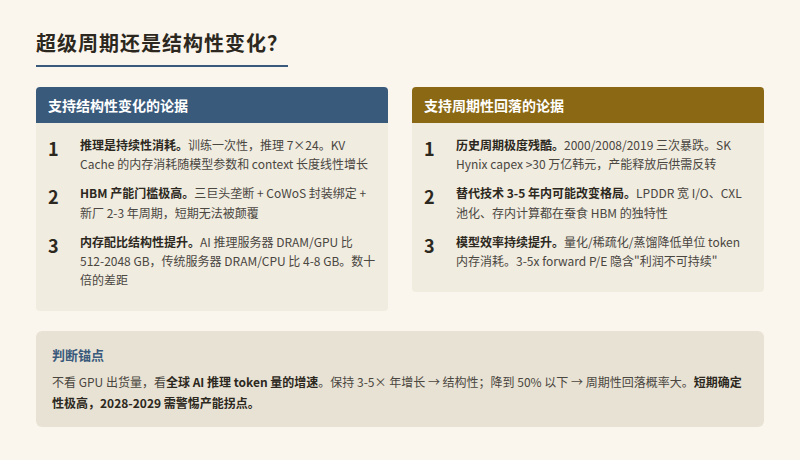
III. Core Thesis: Structural Shift or Supercycle?
3.1 Evidence for "Structural Shift"
-
AI inference memory consumption is persistent. Unlike training, inference runs 24/7 once deployed. Every user request consumes memory,especially KV cache. As model parameters scale from hundreds of billions to trillions and context lengths extend from 32K to 1M, inference memory demand only accelerates.
-
HBM's capacity barrier is extremely high. Three-player oligopoly, tied to TSMC CoWoS packaging, 2–3 year new-fab construction cycles. Even if demand peaks and pulls back, HBM prices won't collapse to cost,because capacity simply can't expand quickly enough.
-
AI data center memory ratios are structurally rising. Traditional servers have a DRAM/CPU ratio of ~4–8 GB/core. AI inference servers have a DRAM/GPU ratio of ~512–2,048 GB/GPU. A single GPU server needs tens of times more memory than a traditional CPU server. This ratio shift won't reverse.
3.2 Evidence for "Still a Cycle"
-
Memory industry cycles are historically brutal. Crashes occurred in 2000, 2008, and 2019. Every price-up cycle stimulates capacity expansion, ultimately leading to oversupply. SK Hynix's 2026 capex exceeds ₩30 trillion; Samsung and Micron are also aggressively expanding. When this new capacity comes online, the supply-demand balance will tip.
-
Alternative technologies could shift the landscape in 3–5 years. Samsung is pursuing LPDDR wide-I/O as a lower-cost HBM alternative; CXL memory pooling could reduce per-server dedicated memory requirements; Processing-in-Memory could reduce data movement volumes.
-
AI model efficiency keeps improving. Quantization (INT8/FP8/INT4), sparsification (MoE), and distillation all reduce per-token memory consumption. If model efficiency improves faster than demand grows, memory pressure eases.
-
Forward P/E of 3–5×. Interestingly, despite SK Hynix and Samsung posting record profits, forward P/E ratios remain at just 3–5×. The market is voting with real money: "We don't believe these profits are sustainable." This may be the lowest forward P/E moment in memory industry history,not because stock prices haven't risen, but because profits have risen even faster.
Near-term (2026–2027): Very high certainty. HBM capacity is fully sold out, DRAM price increases haven't stopped, NAND shortages persist. AI infrastructure investment shows no signs of decelerating.
Mid-term (2028–2029): Proceed with caution. The big three's new capacity starts coming online; HBM4E/HBM5 yield improvements bring more supply. If AI inference demand growth slows (model efficiency gains or application scenarios falling short), a supply-demand inflection point could emerge.
Core anchor for the thesis: Don't watch GPU shipments,watch inference token volume growth. If global AI inference token volume sustains 3–5× annual growth, memory demand is structural. If growth drops below 50%, the probability of a cyclical pullback is high.
What would make this thesis wrong?
- AI application scenarios contract abruptly (regulation, safety incidents, ROI skepticism causing enterprises to slash AI spending)
- A new memory architecture drastically reduces per-token memory consumption (e.g., 1-bit quantization or an entirely new attention mechanism)
- China massively expands capacity, breaking the three-player oligopoly (low probability, but non-zero)
IV. China Perspective: The Pain of Chip Constraints
4.1 CXMT and YMTC
China has representative companies in both DRAM and NAND: CXMT (DRAM) and YMTC (NAND).
- YMTC's Xtacking architecture has competitive technology in NAND, with 128-layer and 232-layer products in mass production. However, U.S. export controls restrict access to advanced equipment (EUV lithography, advanced etching tools), posing challenges for further technological iteration.
- CXMT is catching up in standard DRAM, with DDR4/DDR5 products available. But it remains far from HBM,HBM requires TSV through-silicon vias and 3D stacking, both demanding advanced manufacturing and packaging capabilities.
4.2 HBM Export Controls and Huawei Ascend
HBM has been placed under U.S. export control. This is a material blow to Huawei Ascend AI chips,the Ascend 910B/950 series AI chips require large-capacity, high-bandwidth memory but cannot access SK Hynix/Samsung/Micron HBM supply.
Ascend's response strategies include:
- Using standard DDR5 + larger on-die SRAM as a substitute (bandwidth and energy efficiency will be significantly lower than HBM solutions)
- Exploring domestic HBM alternatives (still far from mass production)
- More aggressive software-level optimization to reduce memory bandwidth requirements
The implication: China's AI compute bottleneck extends beyond GPU chips themselves into the memory supply chain. Memory controls may be a more subtle but more enduring constraint than GPU controls.
V. Investment Perspective: Understanding Storage Industry Value
This is not investment advice, but the storage industry's investment logic has structural characteristics worth analyzing:
Memory company profit margins are a leading indicator, not a lagging one. In a typical semiconductor cycle, peak margins usually signal a cyclical top. But this time is different: AI data center memory demand may grow faster than capacity can come online, meaning margins could stay elevated for longer than history suggests.
HBM is "the shovel seller's shovel seller." NVIDIA sells GPUs to provide compute for AI training and inference; SK Hynix sells HBM to provide NVIDIA with the GPU's core component. HBM margins even exceed those of the GPU itself,a noteworthy profit distribution pattern in the industry.
NAND has the most elasticity. NAND price swings have historically been more violent than DRAM (because it's easier to add/cut capacity). SanDisk's gross margin leap from 22% to 78% is both opportunity and risk,if AI demand slows, NAND will be the fastest to pull back.
Disclaimer: This article is based on publicly available information, synthesizing SK Hynix Q1 2026 earnings, TrendForce market reports, SanDisk FY2026 quarterly earnings, the Microsoft NSDI 2026 CXL paper, and multi-source market analysis from Motley Fool / Yahoo Finance. It does not constitute investment advice. Data as of June 12, 2026.