
On July 13, 2026, SK Hynix's Seoul-listed shares plunged 15.37%—the largest single-day decline in the company's history. Six days earlier, Samsung had reported a record quarterly operating profit of 89.4 trillion Korean won. On one side, fundamentals at an all-time high; on the other, stock prices at their worst. $1.3 trillion in market capitalization evaporated from the chip sector in two weeks. This is not a story about a bubble bursting. It is a story about how structural market mechanisms can amplify fundamental signals into pricing disasters.
I. The July Paradox
Let us first lay out the timeline.
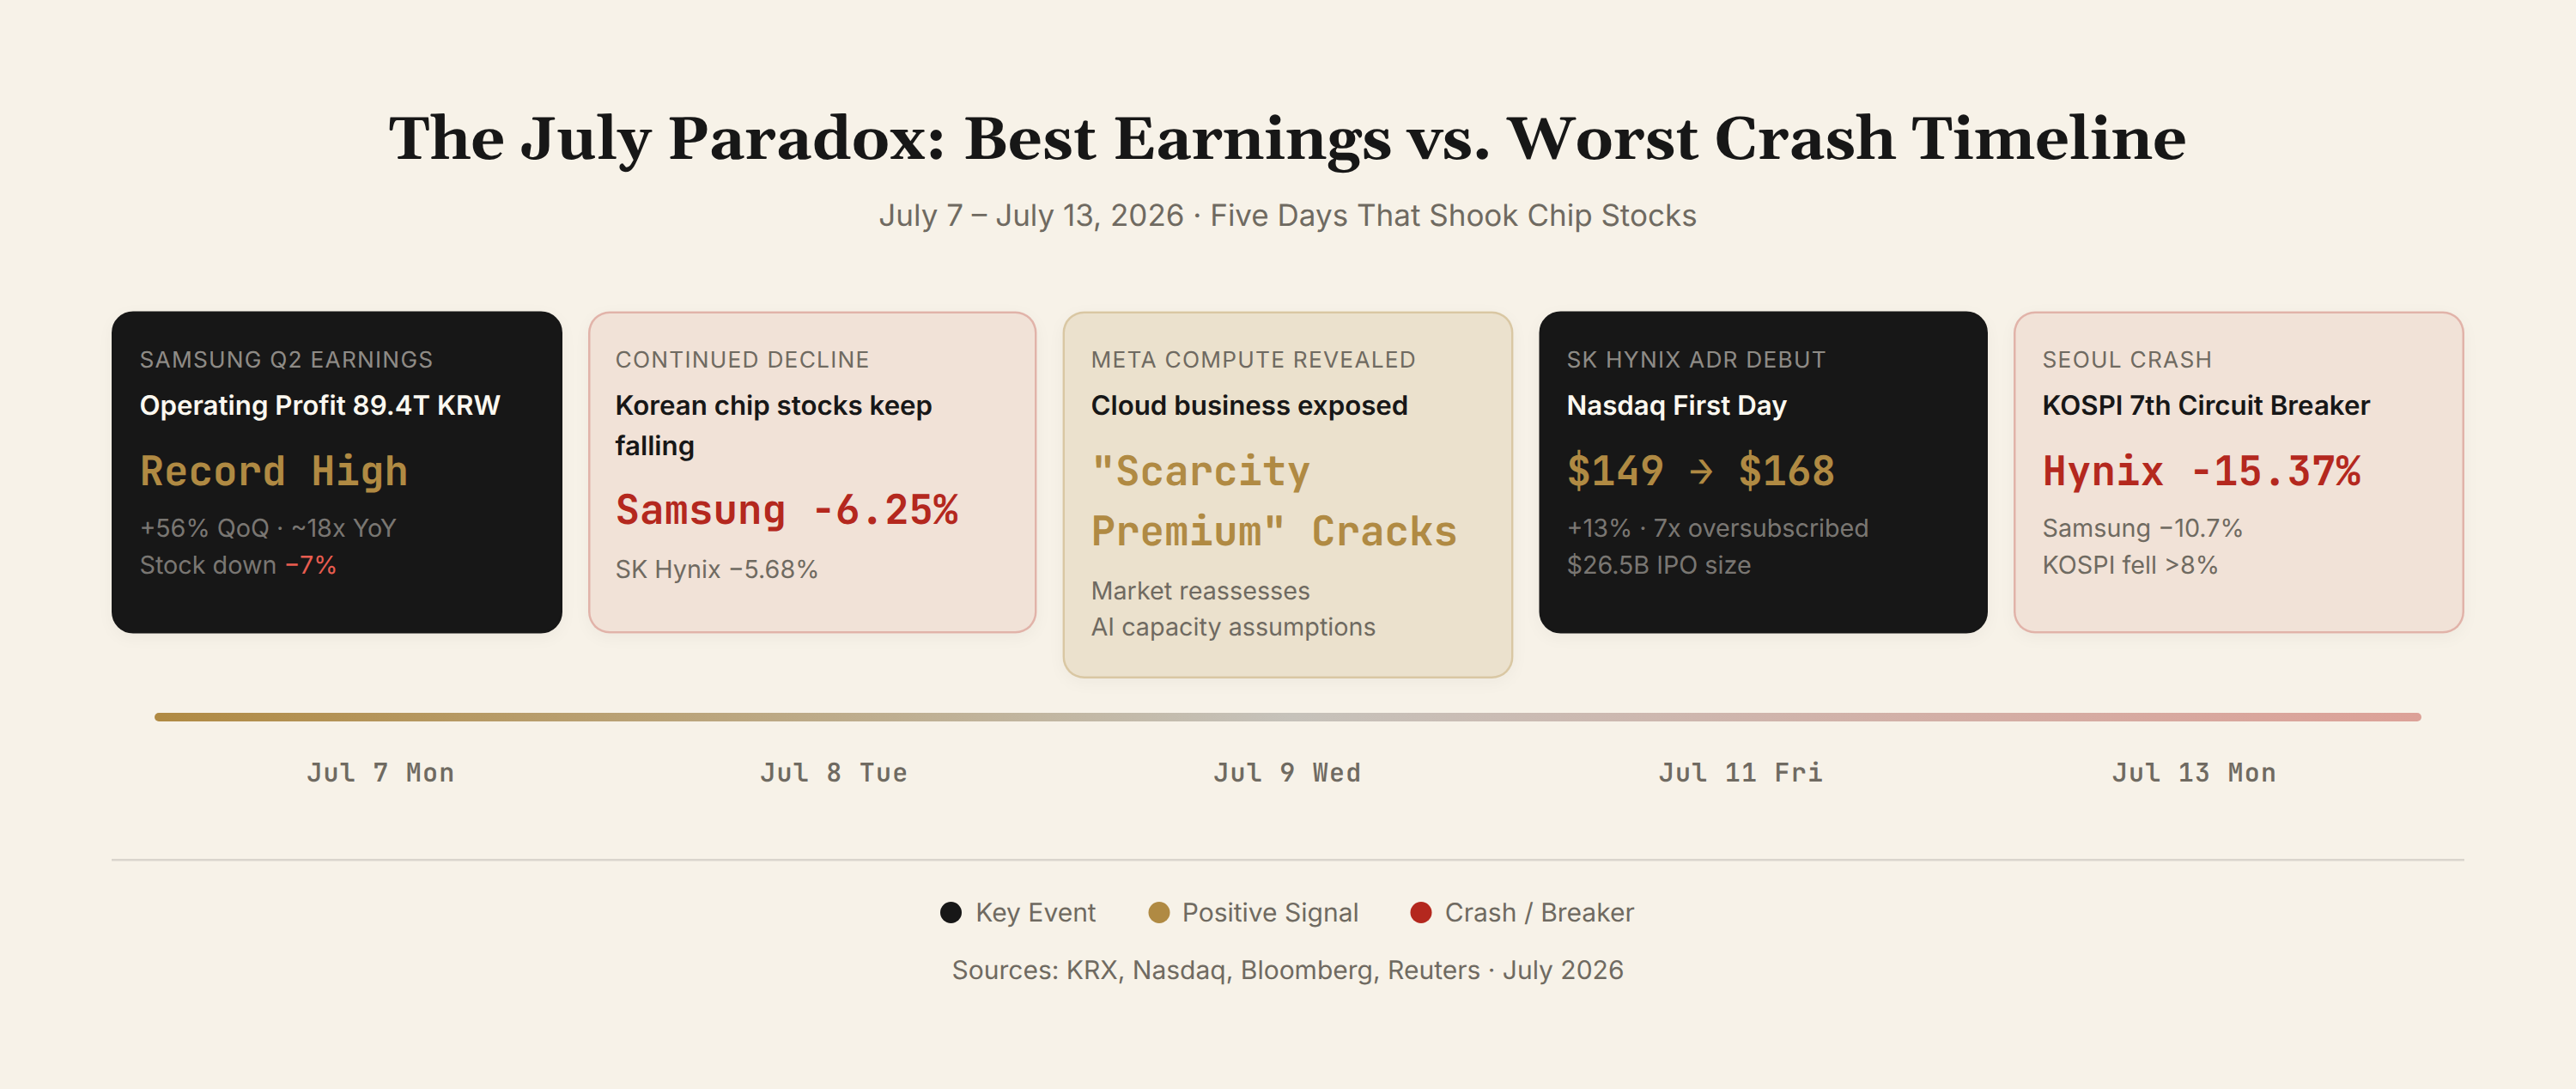
| Date | Event | Market Reaction |
|---|---|---|
| July 7 | Samsung releases preliminary Q2 results: operating profit of 89.4 trillion KRW, +56% QoQ, up ~18x YoY | Samsung shares fall over 7% on the day |
| July 8 | Korean chip stocks continue declining | Samsung -6.25%, SK Hynix -5.68% (Reuters) |
| July 9 | Meta reported to be launching a cloud computing business, selling excess compute capacity | The "scarcity premium" narrative for AI infrastructure takes a hit |
| July 11 (Friday) | SK Hynix ADR lists on Nasdaq, priced at $149, opens at $177, closes at $168.49 (+13%) | 7x oversubscribed, $160B+ in demand (Barron's) |
| July 13 (Monday) | Seoul: SK Hynix -15.37% (largest single-day drop in history), Samsung -10.7% | KOSPI fell over 8%, triggering circuit breaker; 7th of 2026 (Bloomberg) |
This set of data is itself a paradox.
Samsung's Q2 operating profit exceeded Nvidia's FY2026 Q1 operating profit of $58.3 billion (Nvidia FY2026 Q1 earnings report)—the best quarter in Samsung's 55-year history. SK Hynix had just completed the largest foreign-company IPO in U.S. history ($26.5 billion), surging 13% on its first day of trading. Three days later, the same company fell 15% in Seoul.
The market's reaction was completely disconnected from fundamentals. To understand why, we need to decompose the crash into five independent dimensions—only the last of which relates to fundamentals.
II. Dimension One: ADR Arbitrage—A Purely Mechanical Factor
This is the most direct technical cause of the July 13 selloff in Seoul, and the dimension least related to AI demand.
On July 11, SK Hynix listed its ADR (American Depositary Receipt, ticker: SKHY) on Nasdaq, priced at $149, opening at $177, and closing up 13% at $168.49 on its first day. This was the largest initial listing by a foreign company in U.S. history, with the order book oversubscribed 7x and demand exceeding $160 billion (Barron's, July 9; Bloomberg, July 11).
The problem lay in the relationship between the ADR and the Seoul-listed ordinary shares.
Under normal conditions, the premium between a company's ADR and its home-market shares should remain modest. TSMC's ADR typically trades at a 13–14% premium to its Taipei-listed shares (Daniel Yoo, global strategist at Yuanta Securities, CNBC, July 13). But after SK Hynix's ADR listing, the spread between the ADR and Seoul ordinary shares exceeded 20%, creating substantial arbitrage space.
The arbitrage trade was straightforward: buy the ADR, short the Seoul ordinary. Executed across two markets, two currencies, and two time zones, this trade mechanically pushed down Seoul share prices.
Three compounding factors amplified this effect:
First, profit-taking. SK Hynix shares had risen over 500% in the trailing 12 months (Barron's, July 13). The ADR listing was a natural liquidity event, and it was entirely rational for domestic investors to lock in gains.
Second, share dilution. Unlike a typical secondary listing (which merely transfers existing shares to a new exchange), the bulk of SK Hynix's $26.5 billion IPO consisted of newly issued shares—real capital raising, and real dilution. Existing shareholders' ownership was diluted, and the market needed time to absorb the new supply (CNBC, July 13).
Third, currency overlay. On July 13, USD/KRW surged toward 1,500; the won's depreciation further widened the spread between the dollar-denominated ADR and the won-denominated Seoul ordinary shares (Bloomberg, July 13; TechDecode, July 13).
CNBC quoted Daniel Yoo, global strategist at Yuanta Securities, summarizing the situation: "Everybody's really confused about what's going to happen to the memory demand and where the fair price is." (CNBC, "Squawk Box Asia," July 13)
The same SK Hynix—ADR up 13%, Seoul down 15%. This cannot be explained by fundamentals. It is a structural market phenomenon.
III. Dimension Two: $11 Billion in Fund Outflows and $30.5 Billion in Foreign Withdrawals from Korea
The chip stock crash was not confined to Seoul. The entire semiconductor sector experienced the largest capital retreat in a century over the preceding two weeks.
Semiconductor ETF Fund Flows
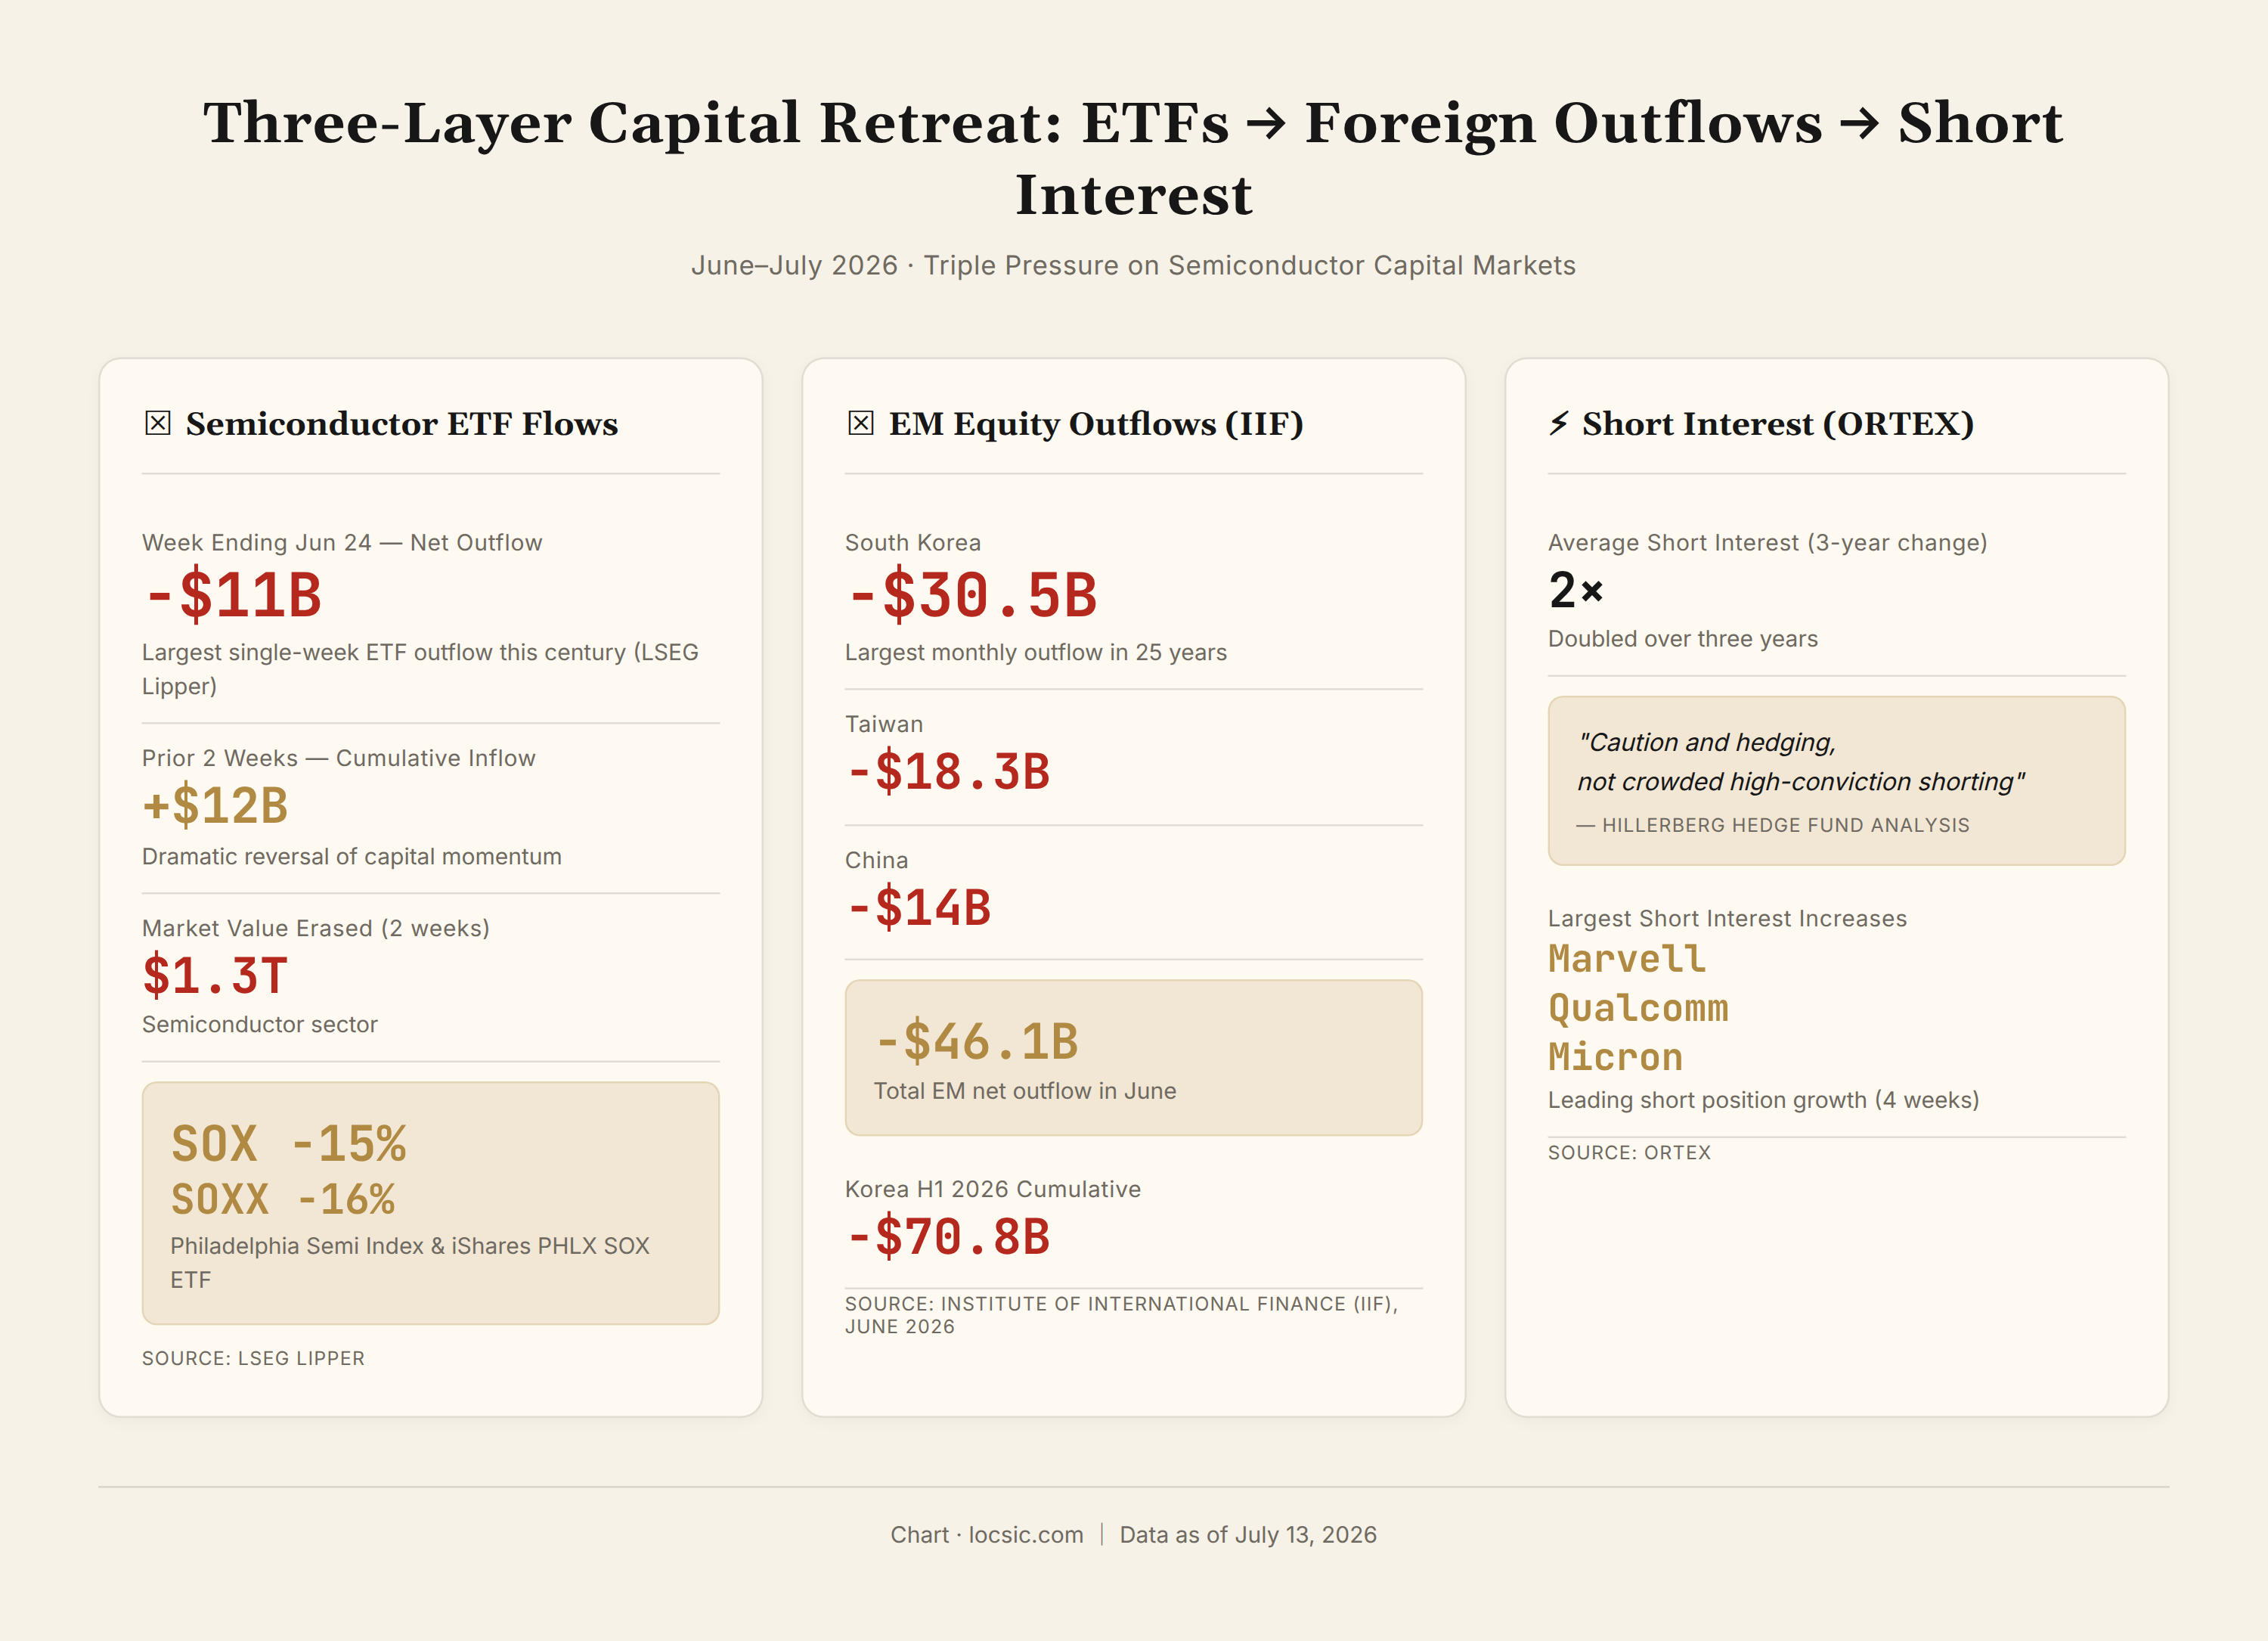
According to LSEG Lipper data, funds tracking U.S. semiconductor stocks saw net outflows of approximately $11 billion in the week ending June 24—the largest weekly outflow this century (Reuters, July 13). For context, these same funds had seen net inflows of $12 billion in the preceding two weeks.
The SOX (Philadelphia Semiconductor Index) fell 15% from its late-June peak, the SOXX (iShares Semiconductor ETF) dropped 16%, and approximately $1.3 trillion in semiconductor market capitalization evaporated in two weeks (Forbes, July 8; MarketWatch, July 7).
The affected companies extended well beyond Korean names: Intel fell 21%, Micron fell 22%, and AMD fell 8% (Forbes, July 8). This was a global sector repricing.
Emerging Market Foreign Capital Outflows
The capital flight facing Korea was even more severe. According to data published by the Institute of International Finance (IIF) on July 10, foreign investors withdrew $30.5 billion from Korean equities in June 2026—the largest monthly outflow in 25 years. Over the same period, Taiwan saw $18.3 billion in outflows and China $14 billion. Emerging market equities as a whole recorded net outflows of $46.1 billion—the combined outflows from Korea, Taiwan, and China were partially offset by inflows into Latin America, emerging Europe, and other regions (Reuters, July 10).
Extending the timeframe to the first half of 2026, foreign investors net sold $70.8 billion in Korean equities and $29.6 billion in Taiwanese equities, with seven Asian markets totaling $137.3 billion—the fastest pace of half-year outflows since LSEG began tracking the data in 2010 (Reuters, July 1).
But the critical question is: these outflows were not driven by bearish convictions.
A Reuters analysis from June 14 explicitly noted that foreign selling of Korean and Taiwanese equities was primarily driven by benchmark rebalancing. Samsung and SK Hynix's combined weight in the MSCI Asia ex-Japan index had ballooned from 8.6% at the start of the year to 21.5%—left unchecked, these two stocks alone would account for more than one-fifth of a portfolio. European UCITS regulations typically cap single-stock exposure at 10%, forcing institutional investors to trim overweight positions (Reuters, June 14).
In other words, foreign investors were not calling the top of the memory cycle. They were executing compliance and risk management.
Short Selling: Hedging, Not Betting on Collapse
ORTEX co-founder Peter Hillerberg provided a more nuanced observation: average short interest in semiconductor stocks had doubled over the past three years, but the largest increases in short positioning were in Marvell, Qualcomm, and Micron (Reuters, July 13).
"This is caution and hedging coming back into the sector, not the kind of crowded, high-conviction shorting that leads to short squeezes." (Hillerberg, Reuters, July 13)
Short sellers were not betting on an AI bubble bursting. They were buying insurance for their long positions.
IV. Dimension Three: Korean Leveraged ETFs—An Underappreciated Amplifier
This is the dimension that American media has barely scratched, and it is the key to understanding why the decline in Korea far exceeded that of U.S. peers.
Korea's Unique Single-Stock Leveraged ETFs
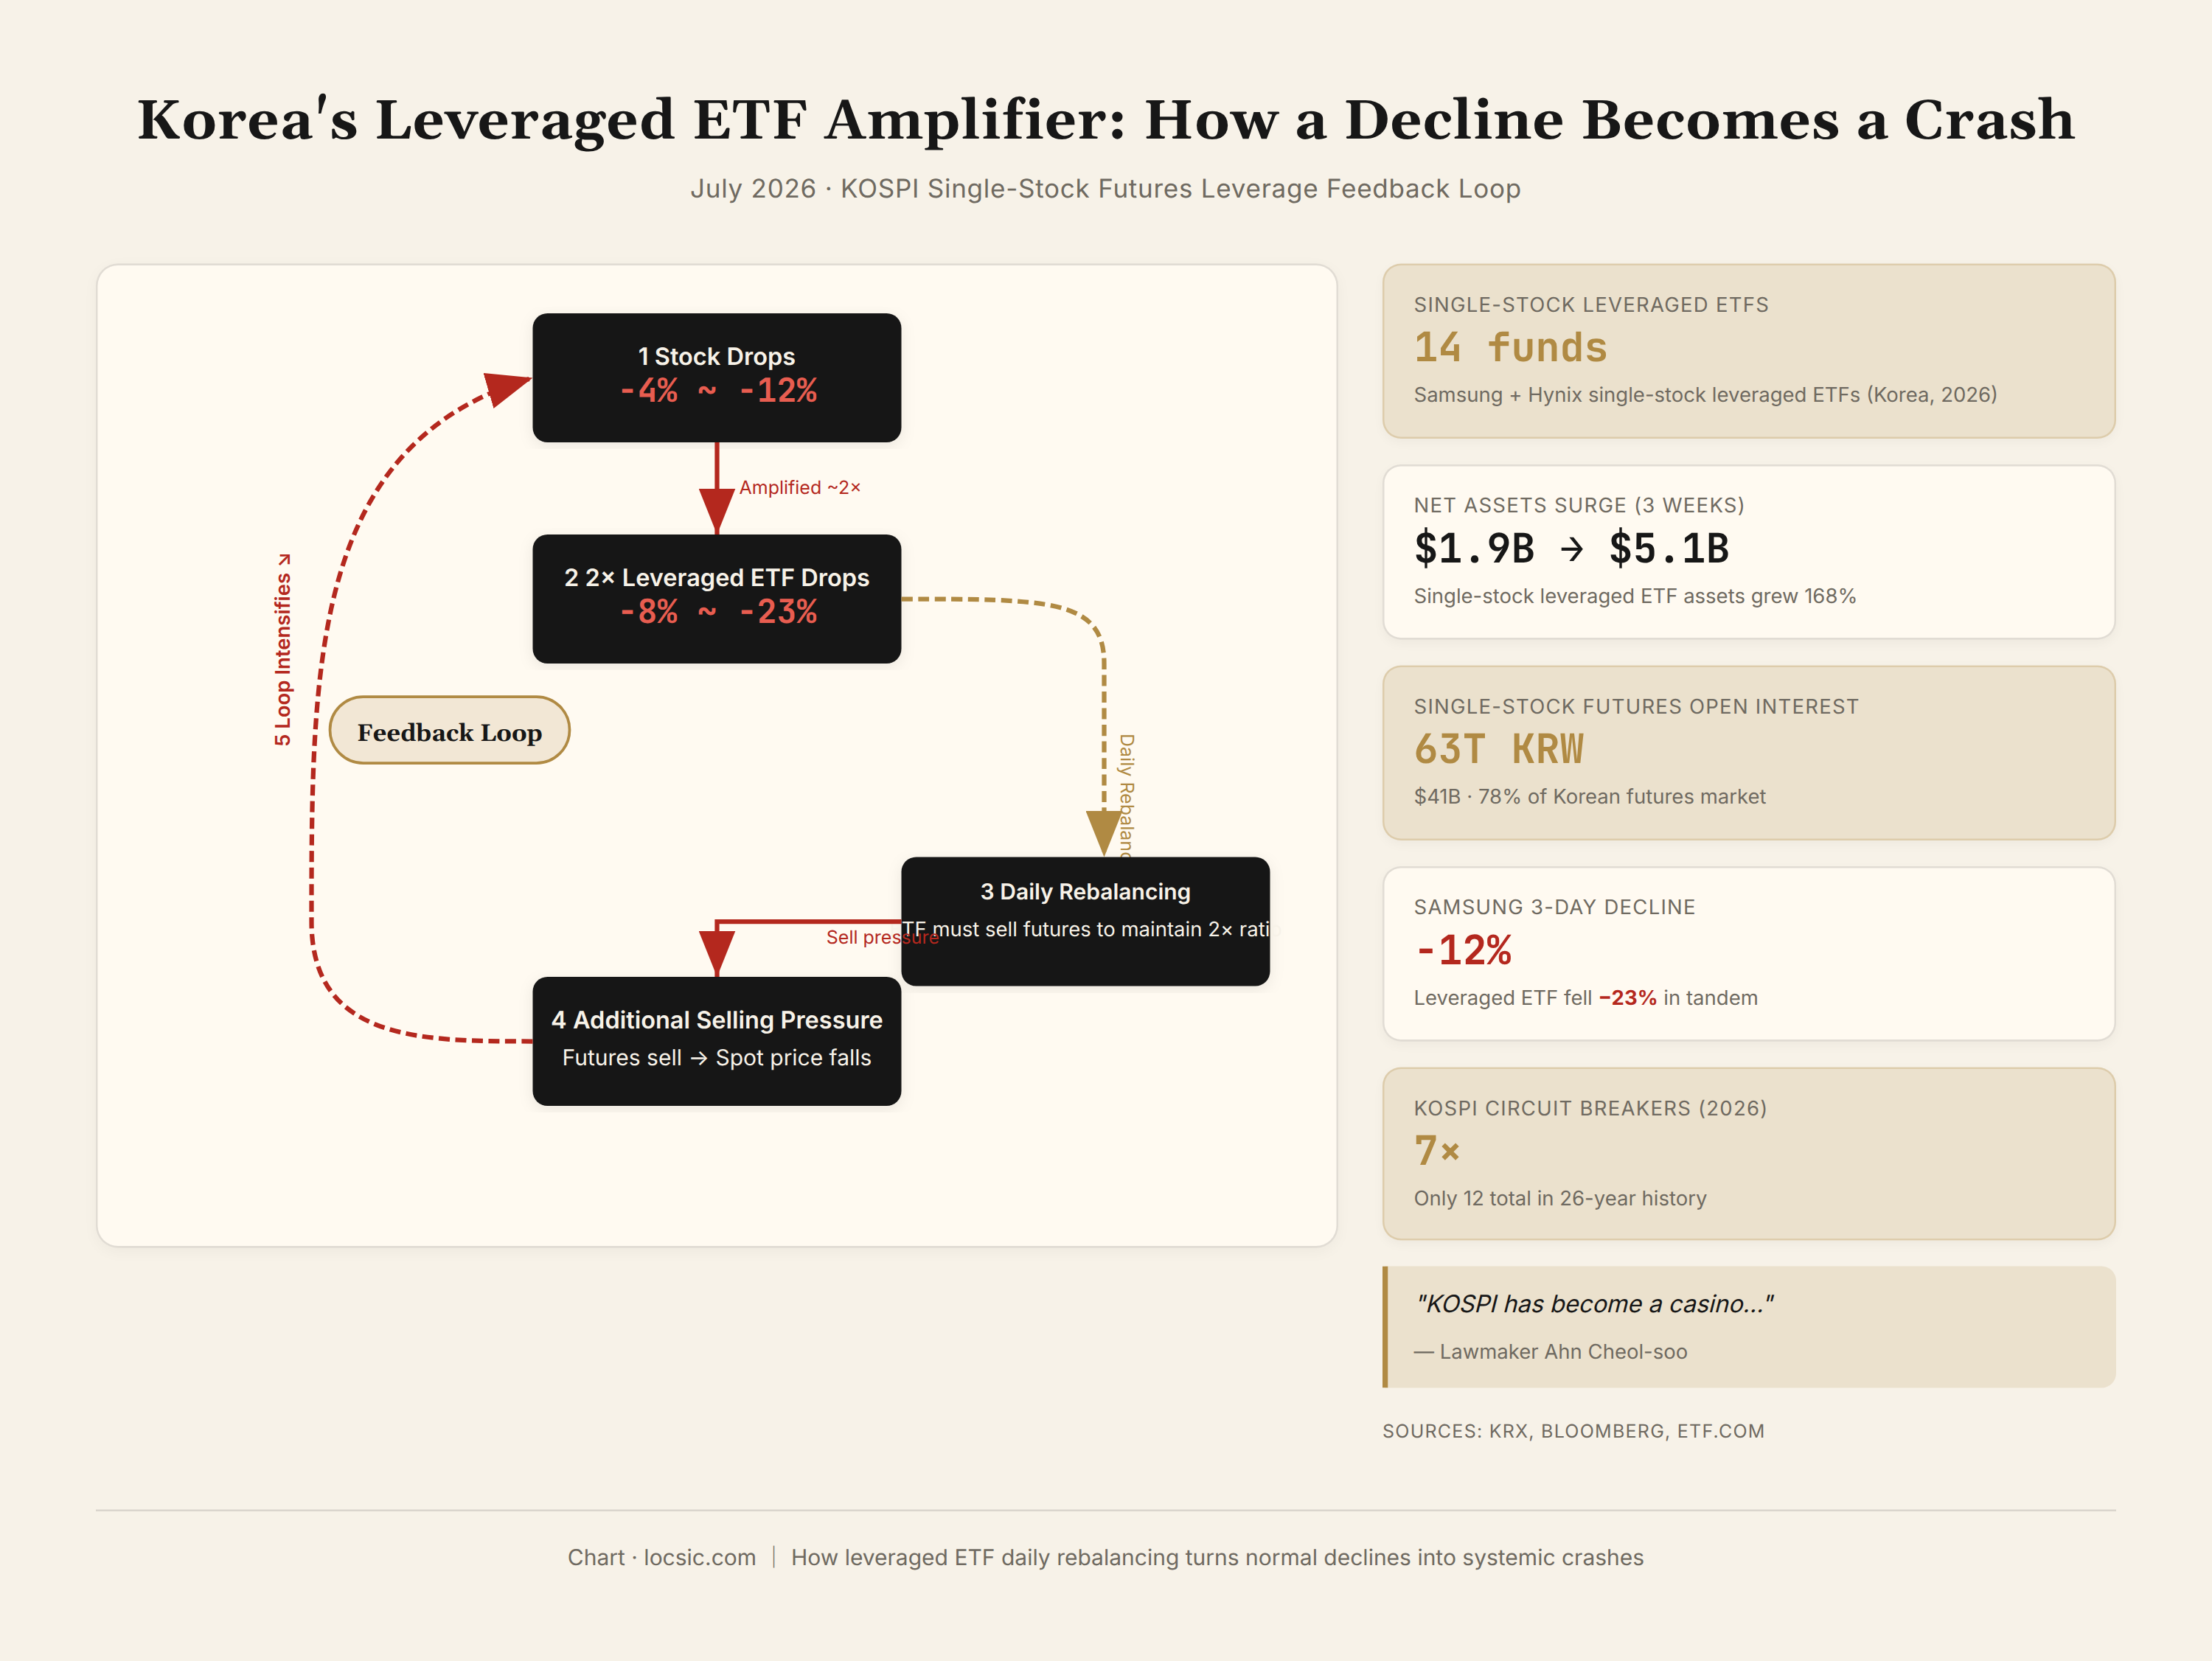
In May 2026, Korean regulators approved single-stock leveraged ETFs for Samsung Electronics and SK Hynix—each product providing 2x long exposure to a single underlying stock. Such products are extremely rare in the United States and Europe (the U.S. has single-stock ETFs but with limited leverage ratios), and they were an entirely new category in Korea.
Within just one month of launch, their scale exploded. According to Korea Exchange and Koscom CHECK data, the net assets of seven SK Hynix single-stock leveraged ETFs surged from 2.94 trillion KRW (~$1.9 billion) on June 27 to 7.75 trillion KRW (~$5.1 billion) on July 17 (Seoul Economic Daily, July 8).
Even more striking was single-stock futures open interest. Open interest in Samsung Electronics and SK Hynix single-stock futures soared to 63 trillion KRW (~$41.1 billion), an all-time high, accounting for 78% of Korea's entire single-stock futures market—two stocks representing nearly 80% of the entire derivatives market (BigGo Finance, July).
The Amplification Mechanism
The mechanics of leveraged ETFs dictate that they become accelerators during declines. A 2x leveraged ETF must rebalance daily: when the underlying falls, the fund must reduce its derivatives exposure to maintain the 2x ratio. This means that on down days, leveraged ETFs are forced to sell stock futures, creating a feedback loop of "decline → rebalancing sell-off → further decline → further rebalancing."
Actual data confirmed this mechanism. Samsung's underlying shares fell approximately 12% over the three trading days of July 7–10, but the KODEX Samsung single-stock leveraged ETF fell approximately 23%—nearly a precise 2x multiple. Over the same period, 13 of 14 Samsung and SK Hynix single-stock leveraged ETFs fell below their issue price (Seoul Economic Daily, July 8; BigGo Finance, July 10).
Korea Exchange data showed that the combined trading volume of two KODEX and TIGER Samsung leveraged ETFs reached 7.75 trillion KRW (~$5.1 billion) in three days—indicating that trading activity around Samsung's earnings release was highly concentrated in leveraged ETFs (BigGo Finance, July 10).
Regulatory Response
Korean regulators sent unusually candid signals of concern. On June 23, the KOSPI plunged 9.99% in a single day, and Lee Chan-jin, governor of the Financial Supervisory Service, publicly stated that approving leveraged ETFs had been "too hasty" (Reuters, June 23). On July 6, Rep. Ahn Cheol-soo of the ruling People Power Party and former presidential candidate posted on Facebook demanding the direct delisting of these products, stating: "The KOSPI has become a casino... devouring trillions of won in corporate value and public wealth every day" (Bloomberg, July 6).
The KOSPI has triggered circuit breakers 7 times in 2026 (all 7 in 2026), while the KOSPI has only triggered circuit breakers 12 times total since the mechanism was introduced in 2000. The Korean VKOSPI fear gauge hit 97.99 intraday in June, the highest since records began in 2009, approaching the unofficial estimate of approximately 103 during the 2008 financial crisis. Buy-side "sidecar" halts (the 5-minute program sell-order suspension triggered when KOSPI 200 futures fall more than 5%) have been activated 29 times in 2026—exceeding the 26 times in all of 2008 (TechDecode, July 13).
Samsung and SK Hynix together account for over 50% of the KOSPI's weight (according to a Reuters report from June 23, the two stocks including preferred shares total approximately 60%; other analysts estimate 50–55%, depending on the index version and timing), and including affiliated companies the figure may approach 65%. In a market dominated by two stocks, with active retail margin trading and leveraged ETFs newly permitted, even small shocks are mechanically amplified into circuit-breaker-level crashes.
V. Dimension Four: Decelerating Price Hikes—The Second Derivative Turns Negative
We finally arrive at the dimension related to fundamentals. But even here, the nature of the story is fundamentally different from the "AI bubble bursting" narrative.
Samsung's Record Earnings
On July 7, Samsung Electronics released preliminary Q2 results: operating profit of 89.4 trillion KRW (~$65 billion), up 56% QoQ and approximately 18x YoY. This figure exceeded Nvidia's most recent quarterly operating profit—the best quarter in Samsung's 55-year history. The driving forces were tight memory chip supply and robust HBM demand (Bloomberg, July 7; TechDecode, July 13).
The stock then fell 7%.
The reason was not that the numbers were bad, but that the rate of growth was decelerating.
The Arc of Price Increases
TrendForce data showed that in Q1 2026, conventional DRAM contract prices rose approximately 90–95% QoQ, with NAND showing similar gains (TrendForce, February survey; SoftwareSeni citation, July). The "~90–95%" figure here refers to the quarterly change in contract prices and does not represent a uniform increase across all DRAM subcategories. The Q2 guidance was for DRAM contract prices to rise another 58–63% (TrendForce, via Ampheo, May).
But the Q3 guidance was DRAM +13–18% and NAND +10–15% (Matterfact Newsletter, July 11, citing TrendForce data). Samsung was reported to have verbally notified customers of a further 20% increase in Q3 (LinkedIn, Amble MarketPuls, July).
The price increase arc went from 90%+ QoQ in Q1 to 13–18% QoQ in Q3. Absolute prices were still hitting record highs, but the "second derivative" of the growth rate had clearly turned negative.
Analyst Downgrades
In the same week as SK Hynix's ADR listing, Korea Investment & Securities cut its SK Hynix Q2 operating profit estimate to 60.4 trillion KRW, below the market consensus of approximately 65 trillion KRW, while lowering its 2026 and 2027 estimates by 9% and 11% respectively (Bloomberg, July 13).
The magnitude of this downgrade was not large—60.4 trillion KRW is still an astronomical figure. But for a stock that had risen 500% in 12 months, any downgrade was sufficient to trigger a "sell the news" reaction.
The Fragility of Being "Priced for Perfection"
An Axios report on July 7 captured the market sentiment precisely: "For a sector priced for perfection, even good news is no longer always good enough." (Axios, July 7)
eToro market analyst Zavier Wong identified a more specific source of market anxiety in a CNBC interview: "concerns that AI infrastructure spending can't keep growing at the pace that has been driving memory prices" (CNBC, July 8).
The core question is not whether demand is still growing—it is. The question is whether the slope of growth is sufficient to sustain current valuation multiples. When the growth rate drops from 90% to 13%, even if the absolute level remains at historic highs, the pressure for earnings multiple compression will emerge.
VI. Dimension Five: Middle East Conflict and the Korean Won—Macro Catalysts
The first four dimensions had laid the kindling; macro events provided the spark.
Over the weekend of July 13, Iran announced the closure of the Strait of Hormuz—the transit route for approximately one-fifth of global oil. The United States conducted additional airstrikes on Iranian targets, and Iran retaliated against U.S. military bases (TechDecode, July 13; Reuters, July 13).
Oil prices surged, and capital fled to the dollar. USD/KRW spiked toward 1,500 that day. The Korean won is one of the less liquid currencies in emerging markets, and oil price shocks have a magnified effect on its exchange rate.
Korea's sensitivity to Middle East conflicts had been repeatedly demonstrated in 2026: a similar Middle East escalation on July 9 had already pushed the KOSPI back below 7,100 (TechDecode, July 13).
At the same time, newly appointed Federal Reserve Chair Kevin Warsh's hawkish stance increased pressure on high-valuation growth stocks (Reuters, July 13; MarketWatch, July 7). The IMF, in its July 8 update, revised down its 2026 global growth forecast to 3.0% and, in a rare explicit warning, flagged "AI market expectation correction risk" (Reuters, July 8).
The macro signals resonated with market sentiment in a chain reaction: oil price shock → Korean won depreciation → accelerated foreign capital withdrawal from Korea → KOSPI crash → leveraged ETF amplification → circuit breaker triggers → panic spreading to global chip stocks.
VII. Memory Market Forecasts: A Quantitative Comparison Across Six Sources
The preceding six chapters dissected the causes of the crash. But for locsic.com readers, the truly important question is: what are the fundamentals actually saying?
The answer: data from every mainstream forecasting institution points in the same direction—the memory supercycle will not end in 2026–2027. The crash reflects valuation and positioning adjustment, not a reversal in demand.
Total Memory Market (DRAM + NAND)
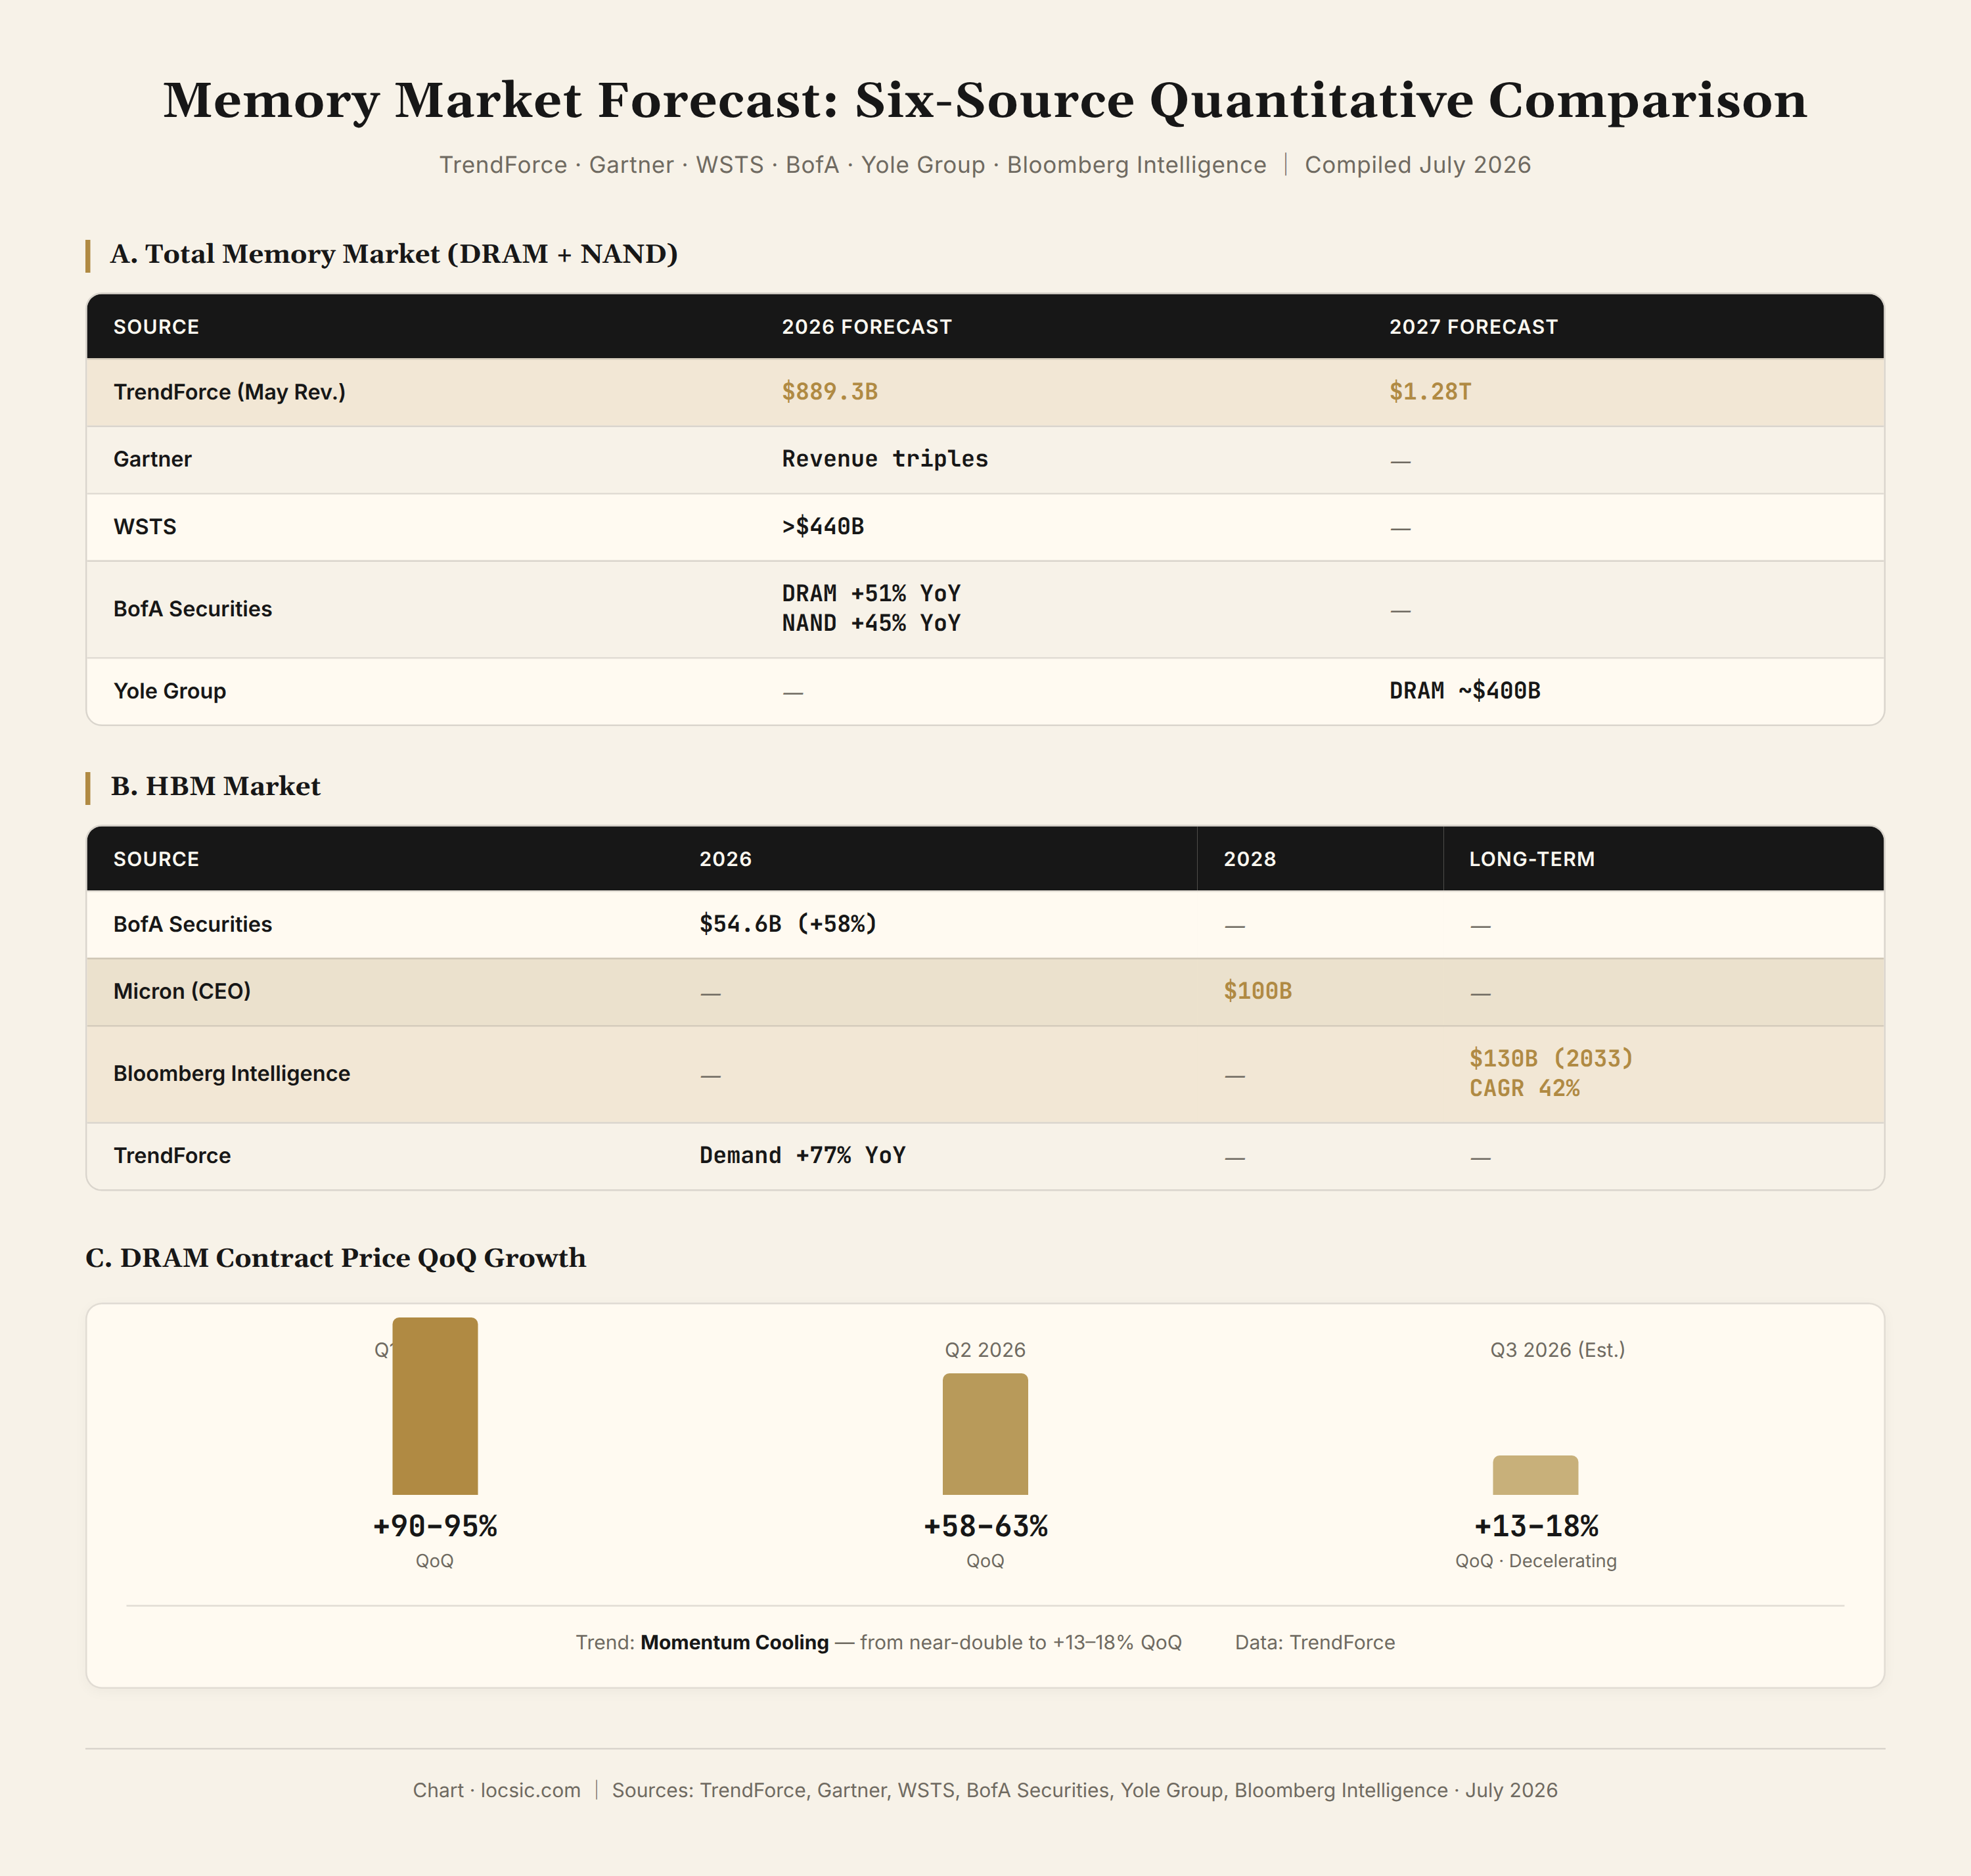
In its May 2026 report, TrendForce dramatically revised upward its memory market forecast, raising the 2026 global memory market projection from $551.6 billion in its January version to $889.3 billion, with 2027 expected to reach $1.28 trillion. Within this, 2026 DRAM market revenue is projected at $618.7 billion (+303% YoY) and the NAND market at $270.6 billion (+280.7% YoY) (TrendForce, May 29).
Gartner's projections were even more aggressive. In its April 8, 2026 forecast, global semiconductor revenue would exceed $1.3 trillion, growing 64% YoY—the strongest growth in 20 years. Memory revenue was projected to triple, with DRAM prices rising 125% on average and NAND 234%. Gartner coined the term "memflation" (memory inflation) specifically to describe this phenomenon (Gartner, April 8).
WSTS (World Semiconductor Trade Statistics) was comparatively conservative, projecting global semiconductor market growth of over 25% in 2026, reaching approximately $975 billion, with the memory segment growing approximately 30%. Some investment banks and market research firms estimated the 2026 memory market size would exceed $440 billion (SK Hynix Newsroom, January 5, citing WSTS).
BofA (Bank of America) defined 2026 as a "super cycle similar to the 1990s," projecting global DRAM revenue growth of 51% and NAND growth of 45%, with ASPs (average selling prices) rising 33% and 26% respectively. BofA named SK Hynix as its global memory industry "Top Pick" (SK Hynix Newsroom, January 5, citing BofA).
Counterpoint Research data showed the Q2 2026 global memory market size at approximately $269.2 billion, up 380% YoY (LinkedIn, InSync Analytics, citing Counterpoint Q3 report).
Yole Group, in its Next-Gen DRAM 2026 report, projected total DRAM market revenue approaching $400 billion by 2027, with HBM reshaping the entire DRAM ecosystem (Yole Group, 2026).
The following is a cross-source comparison:
| Source | 2026 Forecast | 2027 Forecast | Notes |
|---|---|---|---|
| TrendForce (May revision) | Memory market $889.3B | $1.28T | Driven by agentic AI; sharply revised up |
| TrendForce (January version) | $551.6B | $842.7B | Superseded by May revision |
| Gartner | Memory revenue triples | — | DRAM +125%, NAND +234% |
| WSTS | >$440B (memory) | — | Total semiconductor ~$975B |
| BofA | DRAM +51%, NAND +45% YoY | — | "1990s-grade super cycle" |
| Yole Group | — | DRAM ~$400B | HBM reshaping DRAM ecosystem |
The discrepancies across sources are primarily due to differences in scope: TrendForce includes the full value of HBM module packaging and enterprise SSDs; WSTS only counts bare die ex-factory sales; Gartner's "tripling" uses 2025 as a baseline and includes memory-related services. Different scopes lead to large gaps in absolute numbers, but the direction is entirely consistent: the memory market is in a period of historic growth in 2026–2027.
HBM Segment
HBM is the core engine of this memory supercycle, and also the subcategory with the greatest divergence of opinion.
BofA estimated the 2026 HBM market size at $54.6 billion, up 58% YoY (SK Hynix Newsroom, January 5, citing BofA). Goldman Sachs projected that HBM demand for custom ASIC AI chips would grow 82%, accounting for one-third of total HBM demand (SK Hynix Newsroom, January 5, citing Goldman Sachs).
Bloomberg Intelligence, in its deep-dive report from January 2025, projected the HBM market would grow from $4 billion in 2023 to $130 billion by 2033, a compound annual growth rate (CAGR) of 42%. The report noted that even if production capacity doubled annually, HBM oversupply would not materialize before 2033 (Bloomberg Intelligence, January 13, 2025).
Micron CEO Sanjay Mehrotra stated on the earnings call that HBM production capacity for all of 2026 was completely sold out, with agreements reached with customers on both price and volume. He projected the total addressable market (TAM) for HBM would reach $100 billion by 2028, a significant leap from $35 billion in 2025. Currently, Micron can only meet 50–67% of core customer demand (LinkedIn, Amble MarketPuls, July, citing Micron earnings call).
TrendForce / Chosun Biz data showed HBM demand growing 77% YoY in 2026, with a further 68% increase in 2027. HBM4E is projected to account for approximately 40% of total HBM demand in 2027 (TrendForce, November 13, 2025, citing Chosun Biz).
Silicon Analysts' HBM pricing dashboard (July 2026 update) provided current price benchmarks: HBM3 at approximately $200/stack, HBM3E at approximately $300/stack, HBM4 estimated at approximately $500/stack (Silicon Analysts, July).
The following is a cross-source HBM market size comparison:
| Source | 2025 | 2026 | 2027 | 2028 | Long-term |
|---|---|---|---|---|---|
| BofA | $34.6B | $54.6B (+58%) | — | — | — |
| Bloomberg Intelligence | — | — | — | — | $130B (2033), CAGR 42% |
| Micron (Mehrotra) | $35B | — | — | $100B | — |
| TrendForce / Chosun Biz | — | Demand +77% YoY | Demand +68% YoY | — | HBM4E = 40% of 2027 demand |
It should be noted that different sources define "HBM market size" very differently. Market reports from firms such as Research and Markets and Precedence Research yield figures ($4–9 billion for 2026) far below those from investment banks and industry research (BofA: $54.6 billion), because the former calculate only the value of HBM bare dies, while the latter calculate the full module value including packaging and testing. This article adopts the BofA scope, as it most closely approximates how HBM revenue is recognized in public company financial statements.
Supply Side: Three-Player Oligopoly, Fully Sold Out
The HBM supply side is highly concentrated—Samsung, SK Hynix, and Micron collectively control over 95% of qualified global production capacity (Mordor Intelligence, 2026). As of July 2026, all three companies reported that full-year HBM production capacity was sold out.
SK Hynix maintains its leading position in the HBM market. According to Counterpoint Research data, SK Hynix held a 62% share of HBM shipments by volume in Q3 2025, with a 57% revenue share. Goldman Sachs assessed that SK Hynix would "maintain dominance in HBM3 and HBM3E at least through 2026, with total HBM market share above 50%." UBS projected that SK Hynix would capture approximately 70% of the HBM4 market for Nvidia's next-generation Rubin platform (SK Hynix Newsroom, January 5, citing Counterpoint / Goldman Sachs / UBS).
SK Group Chairman Chey Tae-won, in a Bloomberg interview on the day of the Nasdaq listing, said something worth recording:
"We just announced that a few months ago, so we're going to double up our capacity within five years... But my customers said that's not enough. We need it more. So double up is not enough, actually. They want us to close up five times, six times... Our supply capacity is never going to catch up... until our society has reached some settlement with AGI."
(Bloomberg Tech, July 10)
This statement naturally carries an element of promotion—he was ringing the bell that day. But "all three sold out" is a cross-verifiable fact, not a one-sided claim.
Chey Tae-won also revealed a strategic vision: SK Group aims to invest close to $1 trillion (including partner and customer co-investment components) in AI data centers over the next 10 years, with the goal of building approximately 15 GW of computing infrastructure in Korea and approximately 5 GW overseas (Bloomberg Tech, July 10). This is better understood as a strategic direction than a confirmed capex plan.
Micron is also accelerating capacity expansion. Of its $9.3 billion advanced memory expansion projects, the Tongluo facility (a former fab with complete 300mm cleanroom infrastructure) is expected to begin volume production in H2 2027, with Phase 1 capacity exceeding 10% of Micron's global capacity as of Q4 2026 (TrendForce, February 26). Micron has also fully exited the consumer storage market (discontinuing the Crucial brand), redirecting all efforts toward enterprise and AI (Suntsu, Q2 2026 Memory Market Update).
Samsung's strategy is slightly different: leveraging its in-house foundry capabilities, it plans to manufacture the logic die (base die) for HBM4 using its own process technology, seeking to establish a differentiated position in the custom HBM space. TrendForce, citing Chosun Biz, noted that as major global companies develop in-house AI accelerators and expand demand for custom HBM, Samsung's foundry capabilities could become a structural advantage (TrendForce, November 13, 2025).
Demand Side Quantification
TrendForce / Chosun Biz provided specific figures for HBM bit demand growth: +77% YoY in 2026, with a further +68% increase in 2027. This means that even if production capacity expands annually, the absolute increment in demand still far exceeds supply (TrendForce / Chosun Biz, via TrendForce News, November 13, 2025).
BofA's ASP (average selling price) forecasts: DRAM ASP up 33% in 2026, NAND ASP up 26%. Goldman Sachs specifically highlighted the +82% forecast for custom ASIC HBM demand—indicating that AI infrastructure investment is diversifying from general-purpose GPUs (Nvidia) toward dedicated chips (Google TPU, AWS Trainium, in-house accelerators) (SK Hynix Newsroom, citing Goldman Sachs).
Fundamental Changes in Procurement Models
Memory market procurement models underwent a fundamental shift in 2026, further strengthening supplier pricing power.
According to distributor Suntsu's Q2 2026 market update, Samsung, SK Hynix, and Micron have moved some major North American hyperscaler clients to post-settlement pricing: if market prices rise during the contract period, the final invoice price will be adjusted upward accordingly. The traditional ±10% quarterly price adjustment band has been completely eliminated. Suppliers are now choosing customers, not the other way around—allocation priority goes to clients with multi-year commitments and prepayments (Suntsu, Q2 2026).
Samsung has explicitly asked customers to sign shorter, more flexible contracts. Some SK Hynix customers have even proactively funded new production capacity to secure supply—a practice virtually unheard of in the memory industry's history.
Price Trajectory Forecast
Synthesizing data across sources, the arc of memory chip price changes is as follows:
| Period | DRAM Contract Price QoQ Change | Data Source |
|---|---|---|
| 2026 Q1 | +90–95% | TrendForce February survey |
| 2026 Q2 | +58–63% | TrendForce, via Ampheo |
| 2026 Q3 | +13–18% | Matterfact Newsletter, citing TrendForce |
| 2026 Q3 Samsung target | +20% | Samsung verbal notification to customers |
The price increase arc decelerated from 90%+ QoQ in Q1 to 13–18% QoQ in Q3. Absolute prices continue to set record highs, but the growth rate has visibly slowed.
This is the direct cause of the shift in market sentiment—not that prices are falling, but that the rate of price increases is narrowing. For a sector priced for perfection, the second derivative of growth turning negative is sufficient to trigger valuation compression.
But all mainstream forecasts point to the same conclusion: prices will not truly peak until at least 2027–2028. Gartner predicted "no material price relief before the end of 2027" (Gartner, via Medium, April 2026). TrendForce's supply-demand model shows that through 2028, conventional DRAM supply growth will continue to trail market demand (SK Hynix internal analysis, via LinkedIn, June 2026).
Synthesized Forecast Judgment
| Dimension | Short-term (2026 H2) | Medium-term (2027) | Long-term (2028+) |
|---|---|---|---|
| Supply & Demand | Extremely tight; all three sold out for the full year | Still tight; new capacity from Micron's Tongluo fab and others begins to release | Gradual easing, but HBM4E new demand layers on top |
| Pricing | Absolute prices continue rising; growth decelerating (QoQ +13–18%) | Price increases slow further | Likely peaking and pulling back; HBM4E premium provides support |
| Market Size | Memory market ~$800–900B (TrendForce) | ~$1.28T (TrendForce) | HBM alone $100B+ (Micron) |
| Equity Risk | High valuations + leverage amplification = high volatility | If price growth rate falls to zero, multiple compression risk | Cyclical correction highly probable; floor far above historical levels |
VIII. Fear vs. Fact
Setting the fear narrative from the preceding seven chapters against verifiable facts:
| Fear Narrative | Fact | Source |
|---|---|---|
| "The AI bubble is about to burst" | TSMC June revenue +68% YoY; Q2 a record | TSMC monthly revenue |
| "Memory chips are in oversupply" | HBM fully sold out for 2026; Q3 price hikes continue | TrendForce, Samsung, SK Hynix, Micron |
| "Meta selling compute = insufficient demand" | Meta is pursuing vertical integration and cost reduction via in-house chips | Reuters, BofA |
| "SK Hynix ADR crash = AI doomsday" | The ADR-Seoul spread arbitrage is a technical factor | CNBC, Yuanta Securities |
| "$11B in semiconductor fund outflows" | $12B flowed in during the preceding two weeks—this is volatility, not a trend | Reuters, LSEG Lipper |
| "Short interest doubled" | "This is hedging, not high-conviction shorting" | ORTEX, via Reuters |
| "$30.5B foreign withdrawal from Korea" | Compliance-driven rebalancing due to MSCI weight exceeding limits | Reuters, IIF |
Why This Is Not 2000
When the dot-com bubble burst in 2000, the problem was not that companies lacked revenue—Cisco had $18.9 billion in revenue and $2.7 billion in profit in 2000. The problem was that valuations had become detached from earnings growth: Cisco's P/E exceeded 100x, while profit growth was decelerating.
The semiconductor sector in July 2026 presents an entirely different picture:
- Samsung's Q2 profit hit a historic high, exceeding Nvidia's
- SK Hynix's full-year 2026 production capacity is sold out
- Nvidia's forward P/E is approximately 19x—a multi-year low (Reuters, July 13)
- S&P 1500 semiconductor index constituents' 2026 profits are projected to double (Reuters, July 13, citing LSEG data)
- BofA projects 2027 global cloud + AI infrastructure capex approaching $1.5 trillion, up 40–50% YoY (Reuters, July 13, citing BofA Securities)
The valuation paradox is stark: Nvidia's forward P/E is at a 10-year low of 19x, while the semiconductor sector just experienced the largest weekly fund outflows of the century. The market is not pricing fundamental deterioration—it is pricing sentiment volatility.
The Real Risk Window
If the memory cycle truly peaks, the most likely time window is 2028, not 2026. Triggering conditions include:
- HBM4E capacity release catching up with demand
- No new killer application emerging (e.g., an AGI-level inference demand surge)
- Hyperscaler capex growth decelerating
- China achieving breakthroughs in domestic HBM production (Mordor Intelligence 2026 estimates an 18–24 month lag, but the timeline is subject to significant uncertainty due to EUV export controls and yield ramp challenges)
Before 2028, all quantifiable supply-demand data points in the same direction: extremely tight.
Methodology and Data Sources
Data sources for this article include: TrendForce (memory market forecasts, contract price tracking), Gartner (overall semiconductor forecasts), Bloomberg Intelligence (long-term HBM forecasts), BofA Securities (memory supercycle definition), Institute of International Finance / IIF (capital flows), LSEG Lipper (fund flows), ORTEX (short selling data), Counterpoint Research (HBM market share), Yole Group (DRAM technology roadmap), WSTS (semiconductor statistics), Reuters / Bloomberg / CNBC / Barron's / Forbes (real-time market coverage), and official disclosures from SK Hynix, Samsung, and Micron.
Cross-verification principle: each key data point requires confirmation from at least two independent sources. Public company financial data is based on company IR disclosures. Capital flow data is based on IIF / LSEG / official exchange data.
This article does not constitute investment advice. Data as of July 14, 2026.