
On August 17, 2026, the first day of SIGCOMM 2026 in Denver, the third Workshop on Networks for AI Computing (NAIC '26) featured a paper just six pages long. The author list is almost entirely Meta production engineers and networking researchers: Prankur Gupta, Miao Xu, Maxim Samoylov, Prashanth Kannan, Rajiv Krishnamurthy, joined by Theophilus A. Benson of CMU. The title is plain, RDMATracer: A scalable eBPF-based framework for tracing RDMA syscalls, describing an eBPF tool that has been running continuously in production for years.
The question it answers is anything but plain: when training jobs crash on hundred-thousand-GPU clusters, why does an entire class of failures stay invisible to every existing monitoring system?
Start with the paper's numbers. At Meta, 5–20% of AI job failures originate in kernel bugs in NIC drivers; within its study window from October 2025 to February 2026, syscall-related failures accounted for 4–15% of all failures. Over a 12-month window, 96% of these failures came with no accompanying application- or network-layer signal (no asynchronous event, no port flap, no transport timeout), and the associated GPU-hours waste was likewise 96% unaccompanied. They happen silently and waste GPU hours silently: the syscall class alone was attributed 7,065 GPU-hours of waste over 12 months, and its share kept rising through the observation window while other failure classes flattened.
It gets worse: even when these failures are captured at the application layer, they get misclassified. Meta's internal NCCL log classifier ALPS mislabels roughly 25% of attempts carrying syscall-failure evidence (weighted by wasted GPU-hours) as "network events." Tickets route to the wrong on-call team, and a dozen engineers across the framework, RDMA-stack, and hardware teams get pulled into weeks of diagnosis. An HPCA 2025 study of large-scale ML cluster reliability observed the same pattern: NCCL timeouts get blamed on proximate causes like the network while the real culprit, say a deadlock, is skipped over.
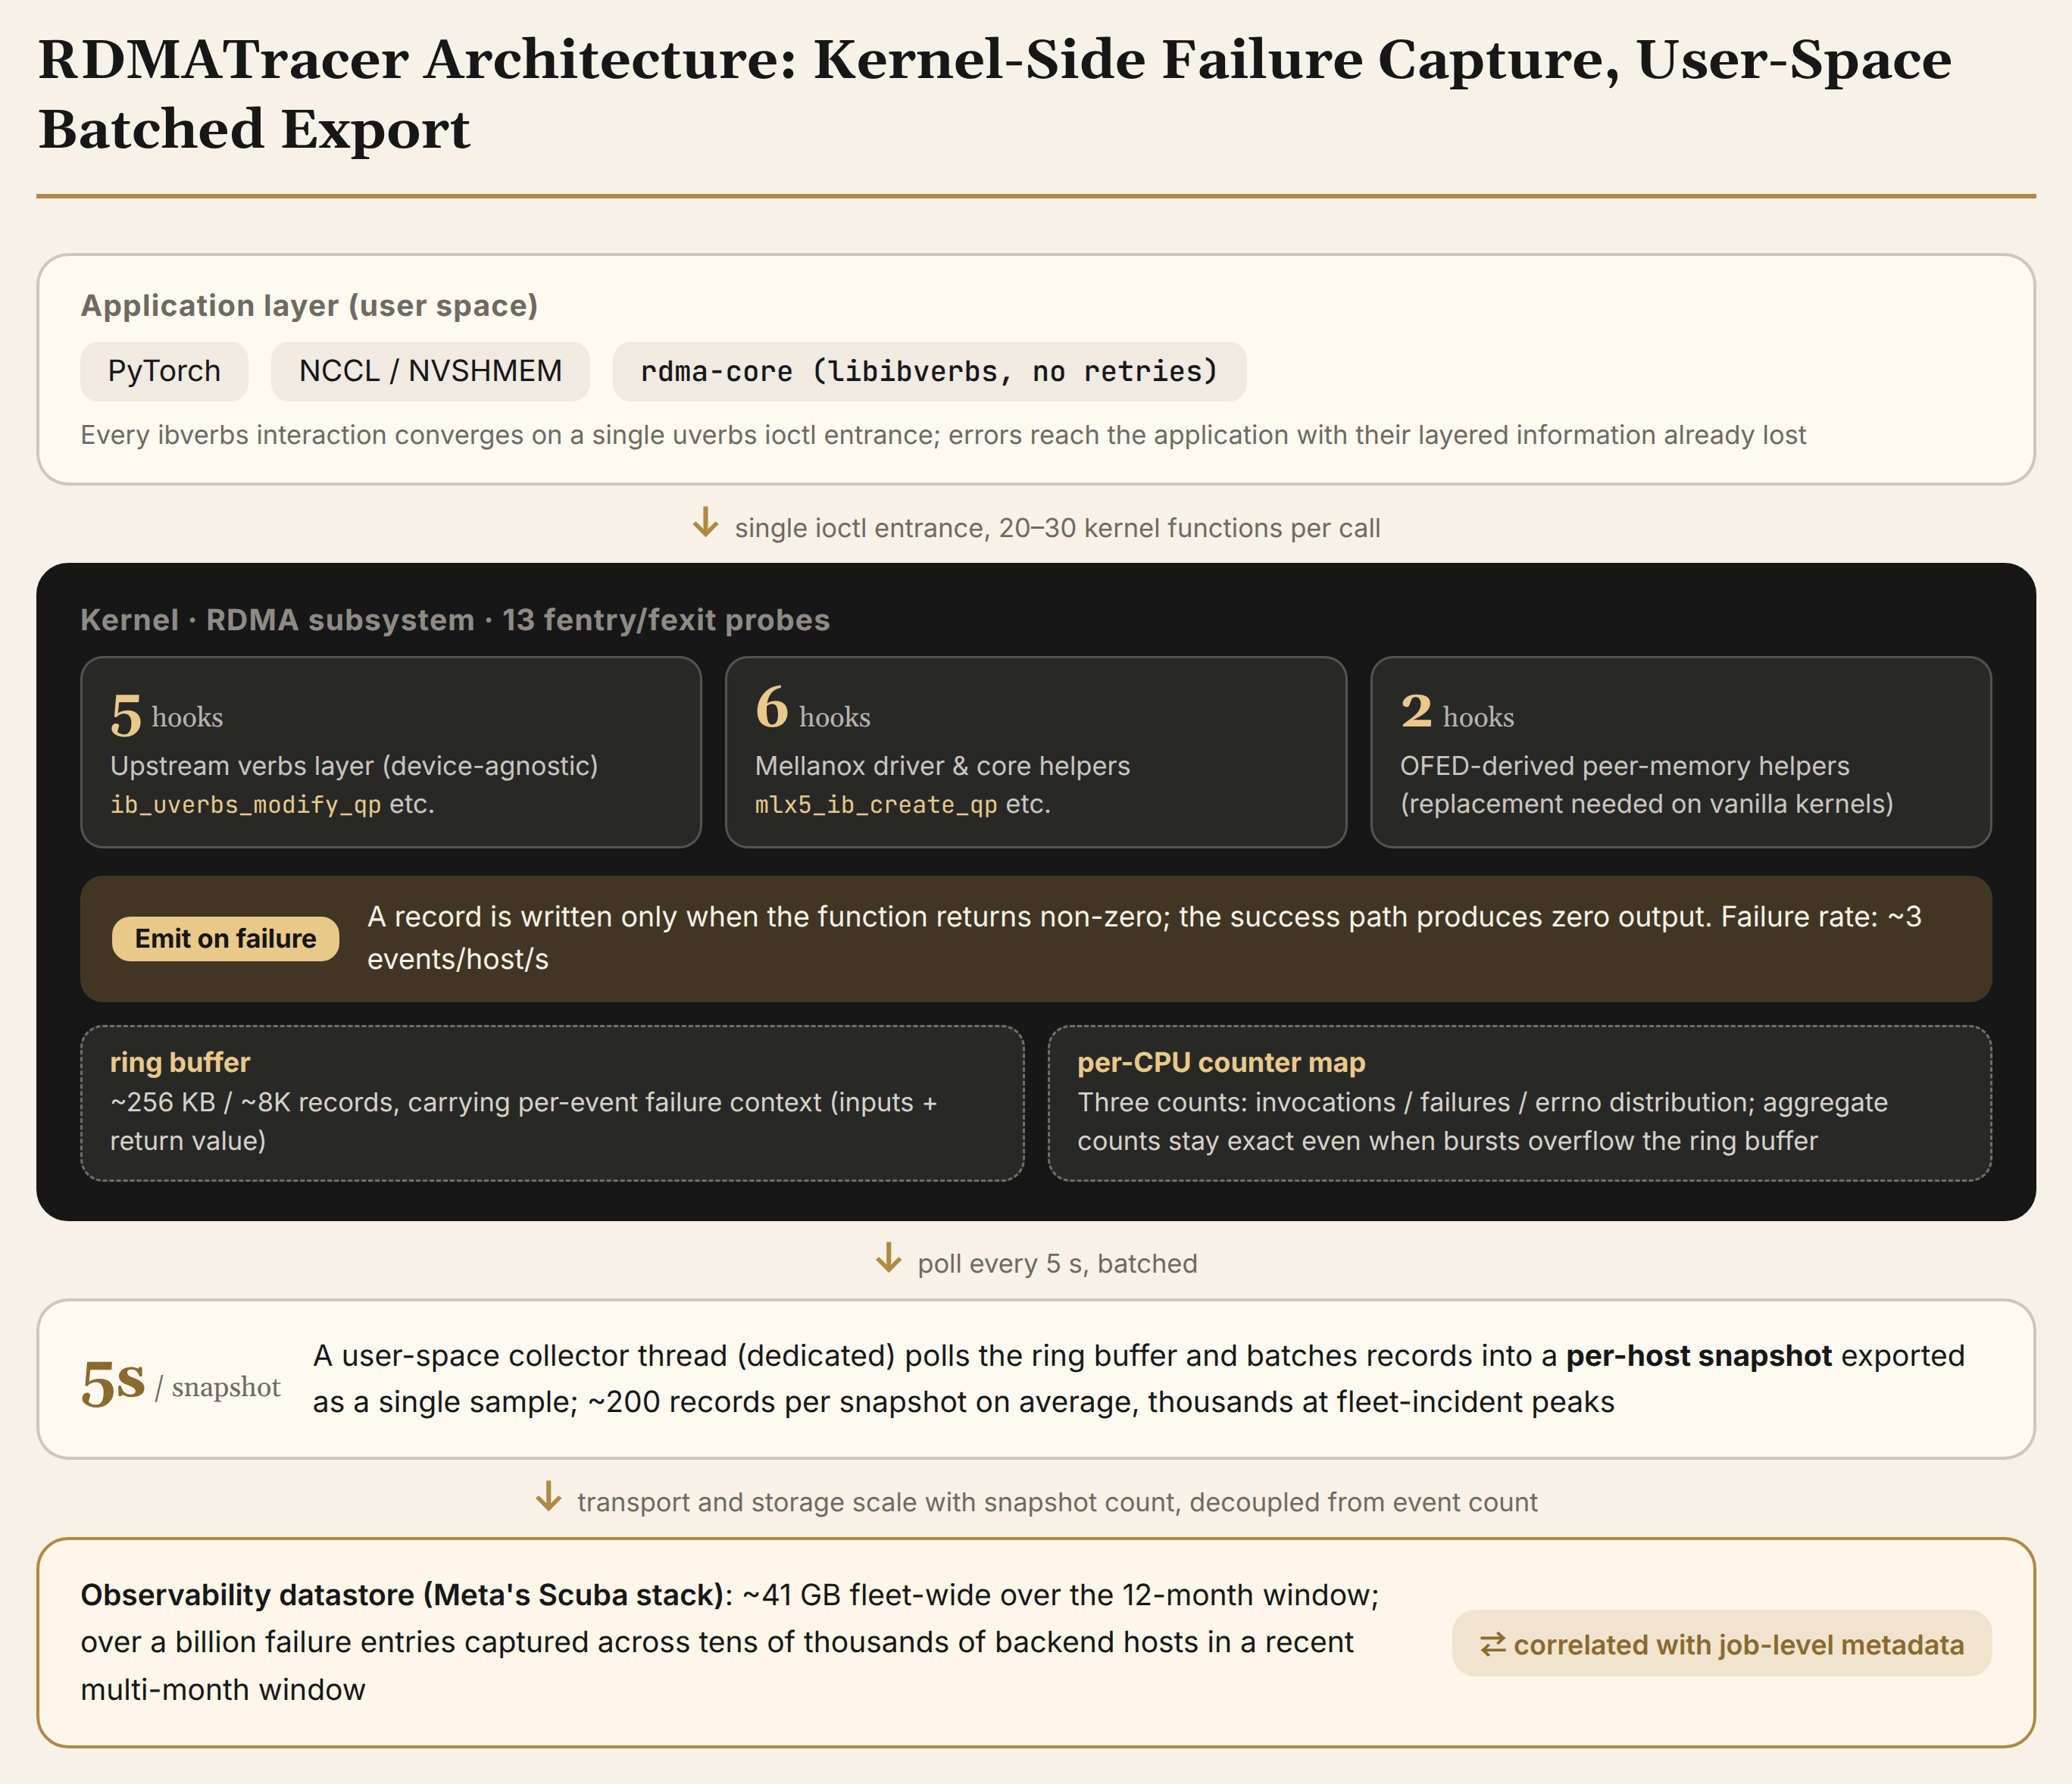
What RDMATracer does, in one sentence: hang 13 eBPF probes on kernel functions in the RDMA control path, write a record only at the moment a function returns non-zero, ship the failure context to an observability datastore in per-host snapshots every 5 seconds, and correlate it with job-level metadata. Its production cost is 0.0000024% of one CPU per host and about 41 GB of storage fleet-wide over 12 months. Routine diagnosis drops from ten-plus minutes to seconds (per the LPC talk). Incidents that once required weeks of multi-team triage are now diagnosed dramatically faster (per the paper), and in some cases RDMATracer's signal foreshadowed later outages by weeks.
This article takes the paper apart: why the problem is structurally hard, how the 13 probes were chosen, why fexit beat kretprobe, why 73% coverage is an honest trade-off, where it sits on the industry observability map alongside algorithmic progress, and what it all means for the larger subject of observability in large-scale AI clusters.
1. After Kernel Bypass, Observability Stayed Behind
RDMA's value proposition is direct: bypass the kernel network stack and let the NIC read and write memory directly. To place it in large-scale training, look first at the network structure of a Meta GPU host, as the FOSDEM talk explained: each GPU host typically carries 8 GPUs attached to three network classes. A scale-up network handles GPU-to-GPU links within a node or supernode; a front-end network carries control and data loading; a scale-out backend network pulls thousands of GPUs into the same collective-communication domain.
Backend NICs are paired with GPUs and run at extreme bandwidth; the conventional kernel network stack cannot keep up, and routing data around the CPU simultaneously cuts latency and raises bandwidth. That is why the data plane must go RDMA. Meta's RoCE practice, the SIGCOMM 2024 paper RDMA over Ethernet for Distributed AI Training at Meta, has proven this route in production.
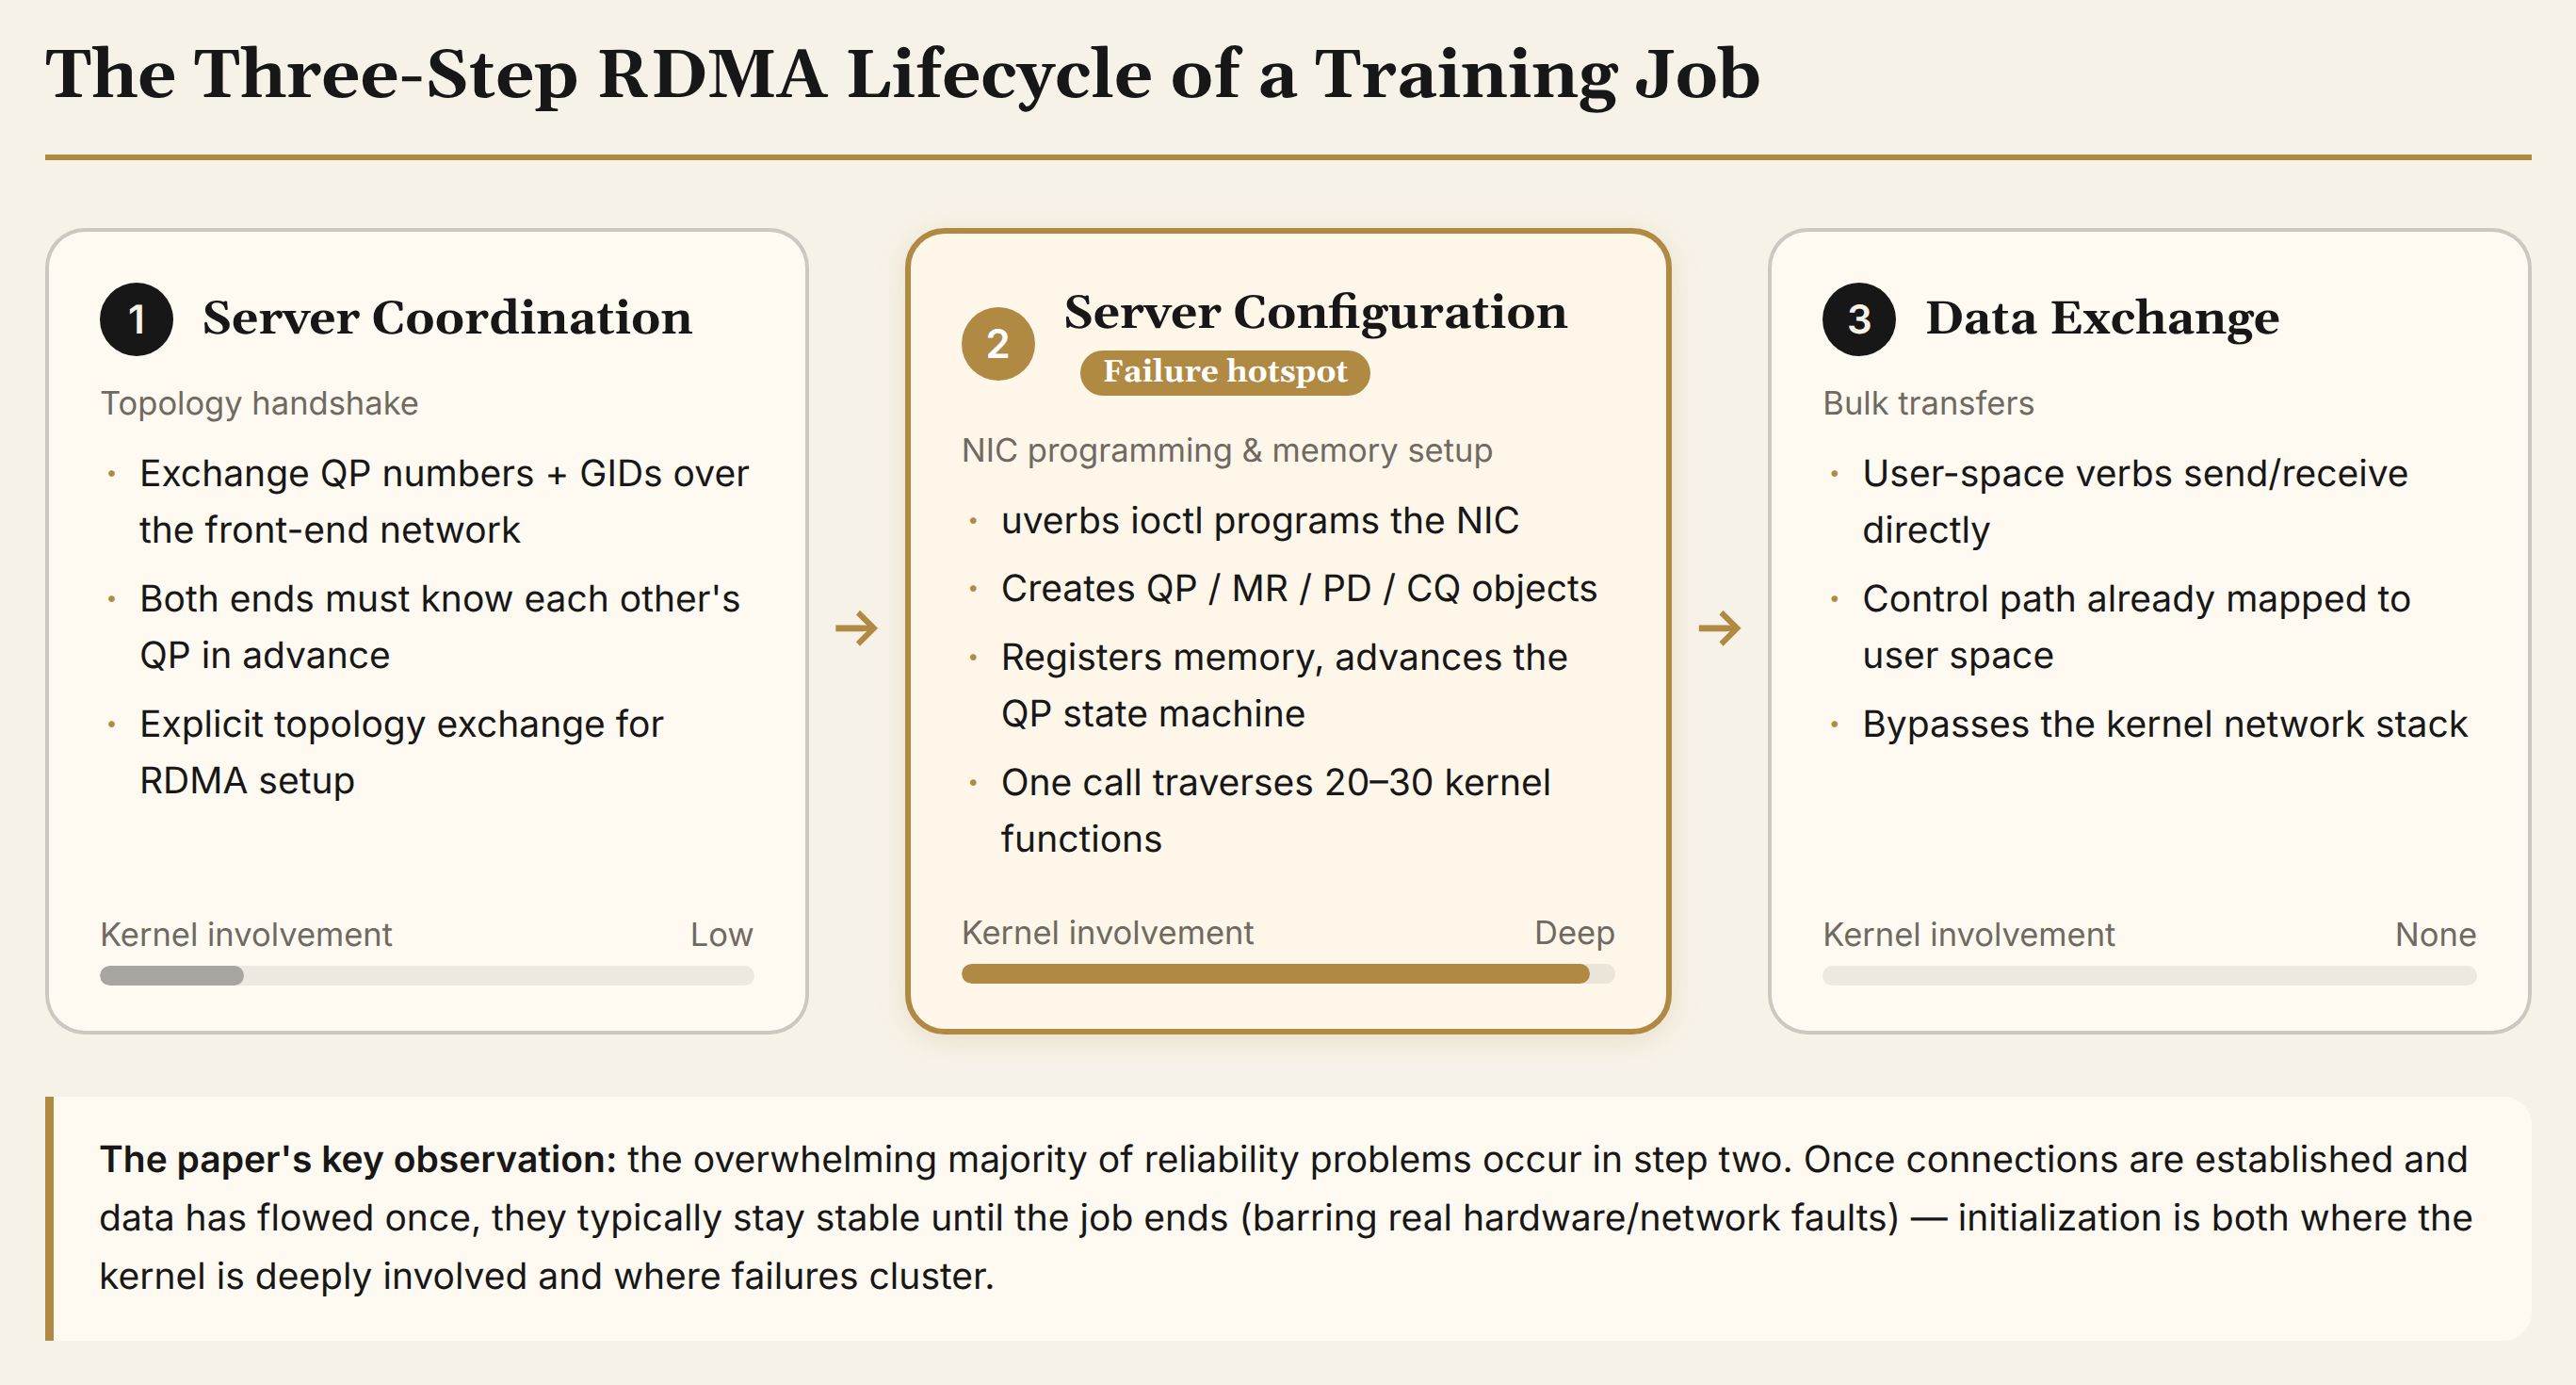
But "bypassing the kernel" is often misread as "the kernel is no longer involved." The paper devotes a section to correcting that impression, and it is the logical starting point of the whole work. An RDMA lifecycle for a training job has three steps.
Step one is server coordination. Nodes exchange queue-pair (QP) numbers and global identifiers (GID) over the front-end network. Unlike the TCP world, where connecting to an IP address suffices, RDMA connection setup requires both ends to know each other's QP numbers in advance; topology information must be exchanged explicitly.
Step two is server configuration. Through the uverbs interface and vendor drivers, the kernel programs the NIC, creates objects, allocates and registers memory, walks QPs through their state machine to ready state, and maps the control path into user space.
Step three is data exchange: the application transacts directly through user-space verbs, and the kernel sees no per-transfer traffic.
The paper's key observation: the overwhelming majority of reliability problems happen in step two. Once connections are established and data has flowed successfully once, they typically stay stable until the job ends, barring genuine hardware or network faults. The FOSDEM talk offered an empirical summary: the initialization phase is where failures cluster, and it is precisely the phase where the kernel is deeply involved. One failure mode is especially punishing: a host enters a persistent bad state, jobs fail at startup, retries burn resources, and the host enters a crash loop. When a flagship training run gets caught in such a loop, escalation is immediate.
Step two is also exactly where observation tools are thinnest. The status quo is a three-layer break.
The entrance collapses into one ioctl. Every ibverbs interaction converges on a single uverbs ioctl entry; one call traverses 20–30 kernel functions, passing through the device-agnostic verbs layer and the vendor-specific driver layer. Stop at the entrance and you see one blurry error code, the same code mapping to many different underlying conditions. The bad news is that there is only one entrance. The good news is that it is the same one for everything: probe at the right depth and all traffic is visible.
Errors reach the application layer, unrecognizable. User-space rdma-core (libibverbs is its core library; uverbs is the corresponding kernel-side entry of that interface) does parameter validation and passing, with no retry logic whatsoever; any kernel-side error propagates upward immediately. NCCL's retry logic is similarly limited: most underlying RDMA errors trigger immediate communication abort and communicator destruction, and the application exits or crashes. What the application log keeps is the topmost translated line, say a generic NVSHMEM initialization failure, while the layered information is lost along the way.
The tools cannot reach it. Traditional diagnosis means grabbing function traces with ftrace by hand, but ftrace does not expose return values. Engineers must compare a successful call's trace against a failed one and guess the fault point from "where the bad trace gets shorter," which requires two comparable invocations, and reproduction is luck-dependent, with faults often resurfacing on a different node. More fundamentally, ftrace is an after-the-fact tool: the job must be stopped, the tracer attached, the failure re-triggered. The paper describes the mobilization for a typical incident: more than ten engineers across the framework, RDMA-stack, and hardware teams, while GPUs idle and waste accumulates at fleet rates.
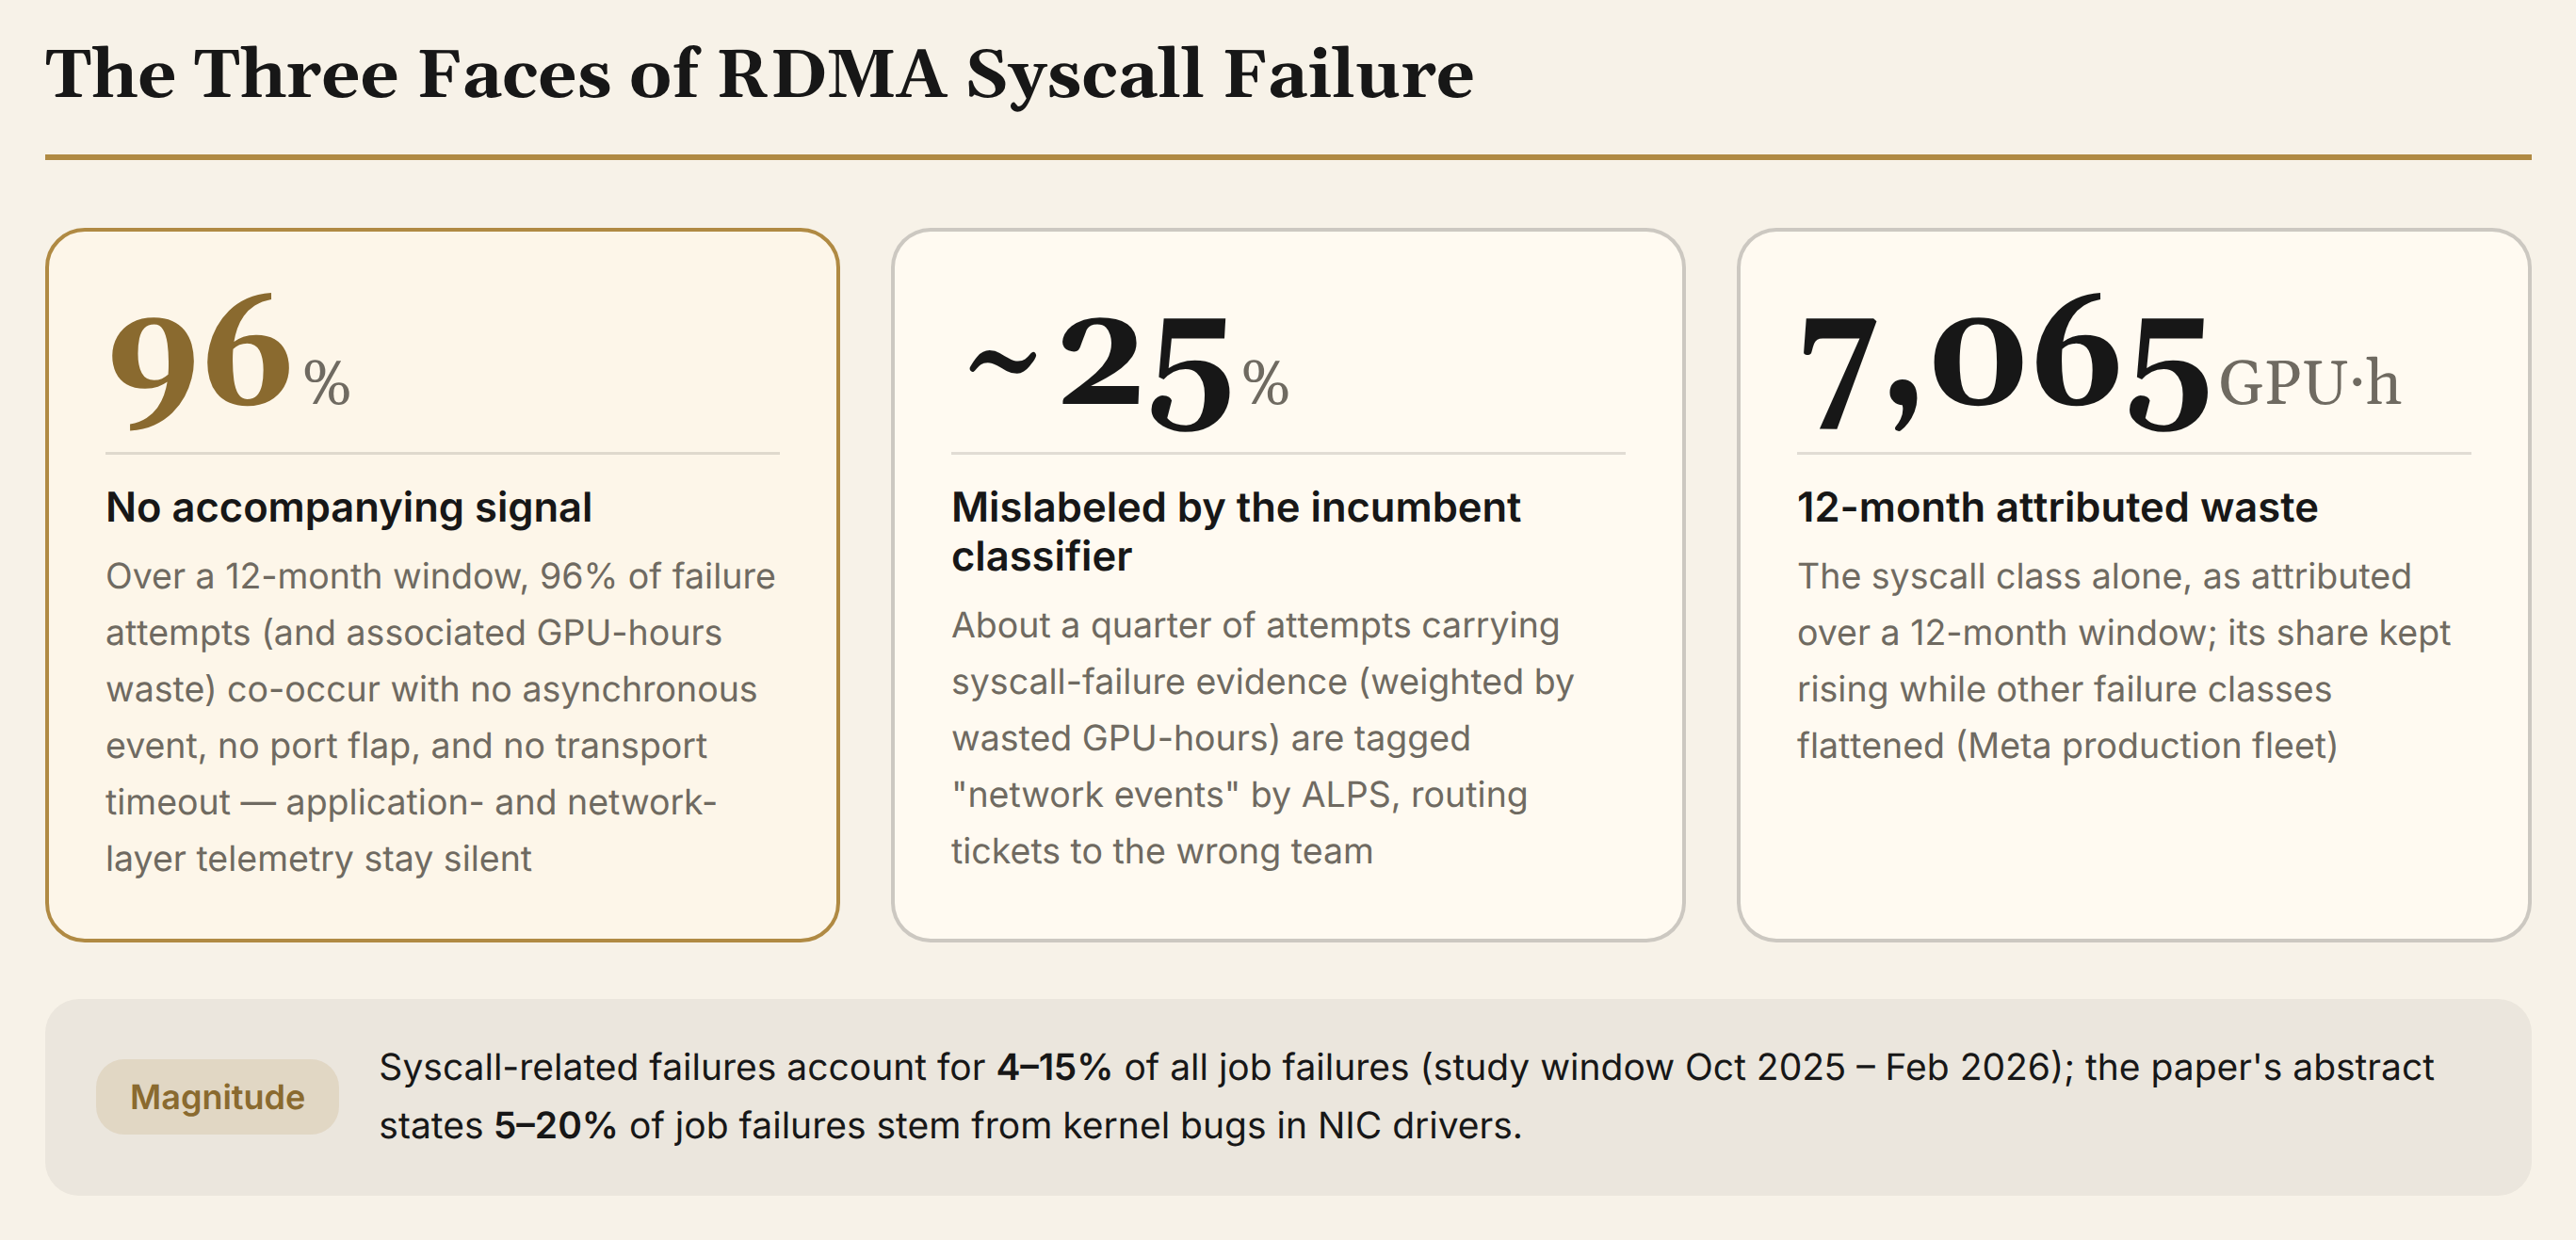
Put the three-layer break together and you get the paper's Section 3 portrait of the failure surface: a class of failures worth 4–15% of all job failures, 96% of the time with no accompanying telemetry, mislabeled a quarter of the time by the existing classifier, with the only reliable observation point deep inside the kernel where conventional tools cannot enter or remain. This is a structural blind spot; adding a few dashboards does not fix it.
2. Thirteen Probes: The Core of an Observability System Is Deciding What Not to Instrument
Section 4 of the paper derives three design requirements from the three properties of the failure surface: invisibility demands kernel-side capture; misattribution demands cross-layer context at the failure point; reproduction cost demands always-on, meaning a failure must be recorded at its first appearance, not after human intervention.
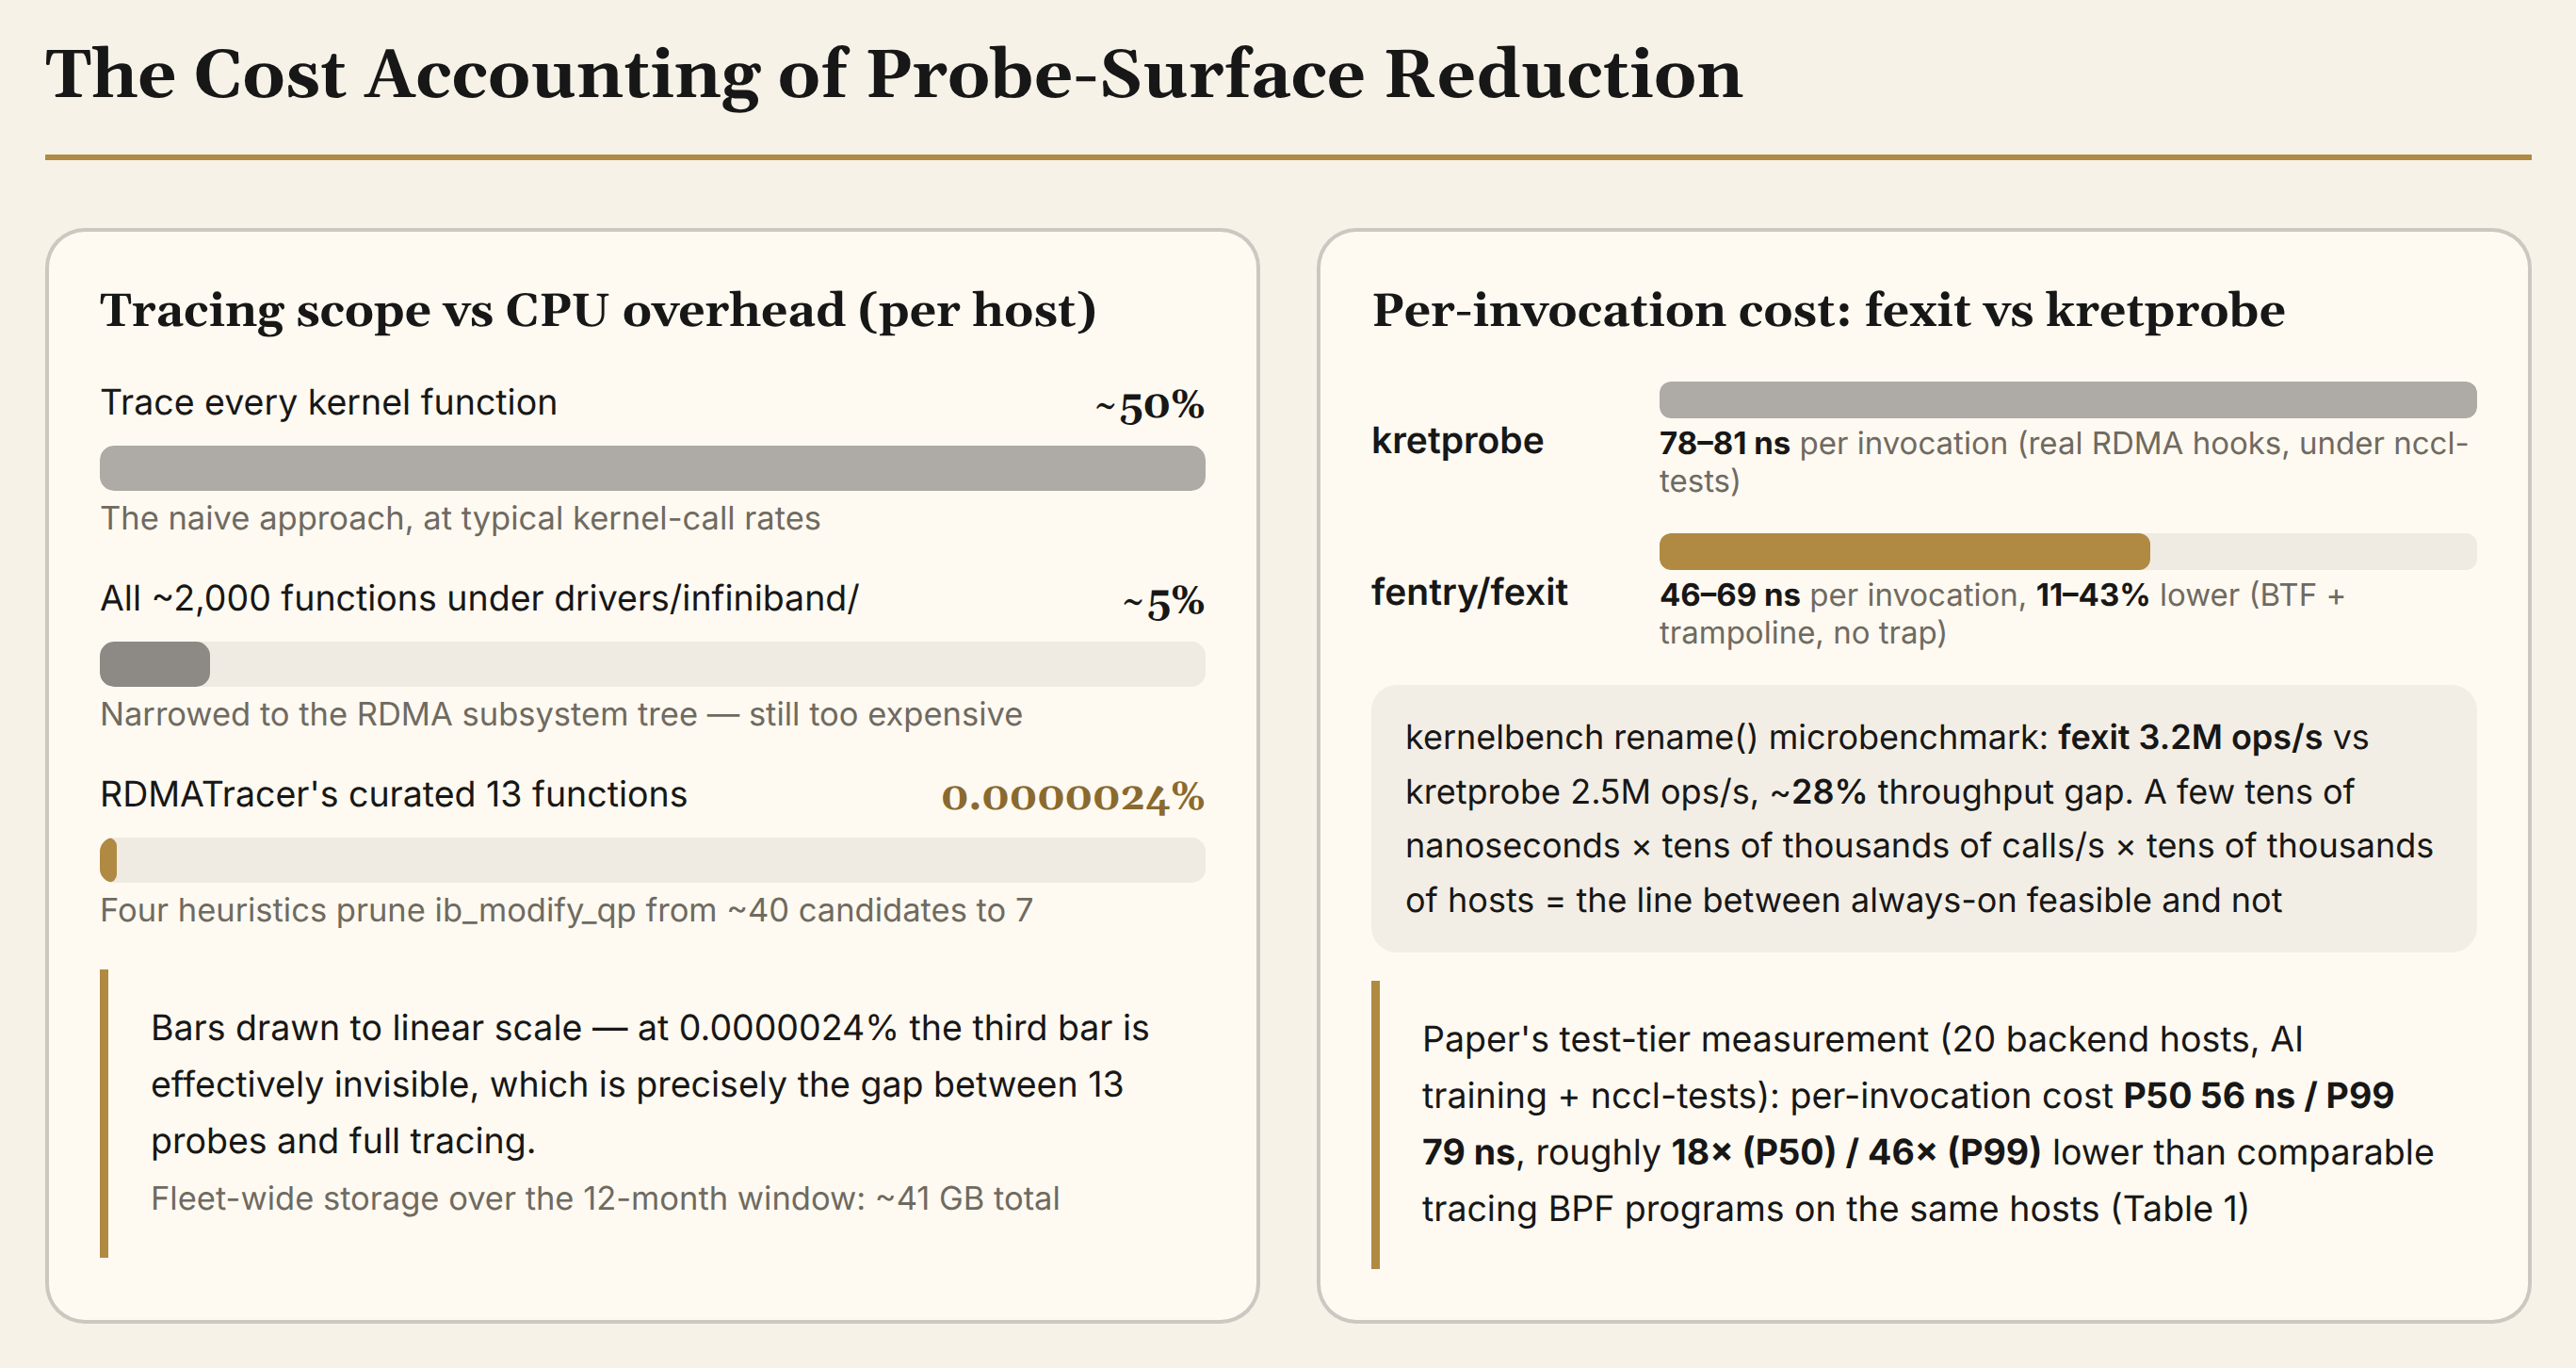
The remaining core question: where to hook. The answer shows this paper's engineering character best. The candidate set comes from static analysis: build the call graph of the RDMA subsystem, enumerate the kernel functions reachable from each ioctl entrance, then prune by rule. Tracing everything is infeasible: naively tracing every kernel function costs roughly 50% of a CPU at typical kernel-call rates; even narrowing to all ~2,000 functions under drivers/infiniband/ still costs ~5% of a CPU per host. RDMATracer ends up hooking 13 functions at 0.0000024% of a CPU. Getting from 2,000 to 13 relies on four heuristics, derived jointly from static analysis and production debugging experience.
Exclude read-only operations. Query and enumeration functions export kernel state without modifying it and rarely cause job failures directly. Some of them also return expected errors like ENOENT on a regular basis (querying a disabled feature, say), and tracing them only manufactures noise.
Exclude generic kernel internals. Locks, paging, RB-trees: when these synchronization primitives and data-structure operations fail, symptoms show up system-wide, not just in RDMA; they offer no RDMA-specific diagnostic information.
Exclude cleanup and reference-counting paths. The most interesting rule. Failures on cleanup paths usually manifest as kernel panics; the call never returns normally, so return-value tracing cannot capture them in principle. Panics have their own diagnostic channel, and covering them anyway is wasted overhead.
Focus on creates and updates of key objects. Queue pairs (QP), memory regions (MR), protection domains (PD), and completion queues (CQ) are RDMA's four core objects, plus the paths that initiate hardware communication. Both the verbs layer and the vendor-driver layer must be instrumented, so every invocation is visible from entry through driver dispatch.
Applied to a single call graph, the heuristics shrink ib_modify_qp from ~40 traceable functions to 7 (the paper's count). The LPC talk showed the symbol list for this path: modify_qp, rdma_lookup_get_uobject, _ib_modify_qp, ib_resolve_eth_dmac.isra.0, rdma_lag_get_ah_roce_slave, rdma_get_gid_attr, alloc_and_bind, rdma_counter_bind_qp_auto. That is eight symbols by name; the .isra.0 suffix is a compiler-optimization artifact, and at the source-function level the list matches the paper's count of 7. Everything on the list is visibly doing state transitions or resource binding; not one is a pure query or cleanup.
The final composition of the 13 probes: 5 device-agnostic upstream verbs handlers (e.g., ib_uverbs_modify_qp), 6 Mellanox driver and core helpers (e.g., mlx5_ib_create_qp), and 2 OFED-derived peer-memory helpers.
This composition hides a piece of engineering judgment worth unfolding: how the probes survive across vendors. The 5 upstream verbs hooks sit in the kernel's verbs core and are device-agnostic by nature. On the driver side, every vendor implements the same ib_device_ops kernel interface, verbs callbacks have equivalents in each vendor namespace (Broadcom's bnxt_re_ prefix, Intel's irdma_ prefix), and the heuristic's namespace gate recovers those equivalents automatically. Only the 2 OFED-derived peer-memory hooks are genuinely non-portable, requiring path-specific replacement on a vanilla upstream kernel. In other words, 11 of the 13 probes are structurally portable across vendors, a property guaranteed by the selection criteria themselves.
3. The Mechanism Trio: fexit, Emit-on-Failure, Dual Planes
With hooks chosen, the paper's eBPF mechanism choices deserve the same item-by-item look.
Why eBPF over ftrace and perf. The argument lands on cost structure: ftrace and perf lack in-kernel filtering and aggregation, so every event must be shipped to user space, with cost scaling linearly in call rate, and RDMA hot-path call rates run 3 to 4 orders of magnitude above failure rates. eBPF puts the decision in kernel space: BTF (BPF Type Format) provides typed argument access, maps hold in-kernel state, and the verifier guarantees probes will not interfere with other BPF programs sharing the host. The paper defines "safe" with footnote-level rigor: independent programs sharing system resources must not suffer unintended interference. The definition looks pedantic; in practice it decides whether probes can be deployed fleet-wide without incident, since other BPF programs, like the network stack's, run on the same hosts.
Why fentry/fexit over kretprobe. Both capture function inputs and return values; the difference is the hooking mechanism. The kprobe family sets runtime breakpoints and pays a trap on every hit, while fentry/fexit, validated against BTF and the kernel version, attach directly to function boundaries via trampolines.
How big is the gap? The paper gives two measured comparisons: on the in-tree kernelbench rename() microbenchmark, fexit sustains 3.2M ops/s versus 2.5M ops/s for kretprobe (~28% throughput gain). On real RDMA hooks under nccl-tests, per-invocation BPF runtimes for the ib_uverbs_modify_qp and rdma_fill_sgid_attr probes are 78–81 ns with kretprobe versus 46–69 ns with fexit, 11–43% lower. For a single probe that is a few tens of nanoseconds. Multiplied by tens of thousands of calls per second, then by tens of thousands of hosts, it is the line between always-on feasible and not.
The paper's test-tier deployment (20 backend hosts running AI training workloads plus nccl-tests) adds a same-host comparison: RDMATracer's per-invocation cost of P50 56 ns / P99 79 ns is roughly 18× lower at P50 and 46× lower at P99 than the population of comparable tracing BPF programs on the same hosts. The LPC talk's self-assessment: "probably the most lightweight BPF on our fleet."
Emit on failure only. The probe logic is one sentence: write a record only when the return value is non-zero; the success path produces not one byte. Failure-event rates on the RDMA control path are naturally low (the paper measures about 3 per host per second on average), so data volume stays contained. This is the design choice that most embodies its observability philosophy: always-on presupposes zero cost in the normal case, or no resident observation survives a production review.
The data path is dual-plane. A ring buffer carries the full context of each failure record (the LPC talk disclosed a capacity of roughly 256 KB / ~8K records), while a per-CPU counter map maintains three counts: invocations per syscall, failures per syscall, and the errno distribution of failures. Exported to a time-series database, the counters carry alerting and accounting as a lighter standing signal than per-event records. The dual plane earns its keep in bursts: when a fleet-wide incident floods the ring buffer, the counters do not drop, aggregate counts stay exact, and details are reconstructed from snapshots afterward.
The control plane also subtracts. A user-space collector thread polls the ring buffer every 5 seconds, batches the records into a per-host snapshot, and exports it as a single sample to the observability datastore (Meta's Scuba stack), correlated with job-level metadata. In production, snapshots average ~200 records, peaking in the thousands during fleet incidents. The kernel only performs per-event ring-buffer writes; transport and storage costs scale with snapshot count, decoupled from event count, and the 5-second interval bounds both the downstream write rate and the detection-to-export latency. A textbook amortized design. The pre-launch regression check was equally rigorous: per the LPC talk, host CPU utilization showed no visible change with the feature on, and workload QPS was unaffected. That is what earned it fleet-wide rollout.
4. 73% Coverage: A Validation That Puts Its Trade-offs on the Table
Any "carefully selected 13" scheme runs into one question: what about the rest? The paper answers with a retrospective validation, my favorite part of the work.
Meta has an independent application-layer classifier, ALPS, built on regex parsing of NCCL logs and, in the paper's words, "built without shared code or design" relative to RDMATracer, making it a natural cross-validation source. Over a 12-month window, approximately 73% of ALPS-labeled syscall failures fall on syscalls whose kernel-side counterparts RDMATracer hooks. The remaining ~27% is what the heuristics deliberately exclude, namely cleanup paths at ~21% (dominated by ibv_dealloc_pd) and read-only paths at ~3% (dominated by ibv_query_gid), all approximate figures as printed in the paper.
The paper does not stop there; it argues why that 21% is more harmless than it looks. First, ALPS attributes an attempt's entire wasted GPU-hours to any teardown-time syscall error, so cleanup-path errors correlate with waste rather than cause it; the number overstates their impact. Second, the real outlet for cleanup failures is the kernel panic, handled by a separate diagnostic flow; return-value tracing is powerless there by construction. Re-attributed by GPU-hours (the paper's Table 2): 12-month total syscall-attributed waste of 7,065 GPU-hours, of which the 13 probes cover ~5,227 (73%) and the rules deliberately exclude ~1,959 (~27%). The table's total and the sum of its parts (7,186) differ by about 120 GPU-hours; the percentages align with the parts, and this article quotes the table as printed.
The beauty of this validation is that it turns "what we don't cover" into part of the design statement, with the trade-offs written explicitly into the paper. The 73% figure needs no defense: it is the direct consequence of two domain judgments, that cleanup-class failures have another exit and that read-only failures are nearly harmless. An observability system's coverage boundary is, in essence, the boundary of its maintainers' understanding of the failure taxonomy.
Deployment numbers complete the story: in continuous production for years, capturing over a billion syscall-failure entries across tens of thousands of unique backend hosts in a recent multi-month window, with fleet-wide storage of roughly 41 GB over the 12-month window. The paper's impact claims are restrained but weighty: diagnosis on incidents that previously required weeks of multi-team triage was dramatically accelerated, and in some cases RDMATracer's signal foreshadowed subsequent outages by weeks. The early signal itself became a data source for failure prediction.
5. Two Case Studies: How Layered Evidence Localizes Root Causes
The paper's two production case studies crystallize the methodology: where an error appears, and where it disappears, is itself localization information.
Case one (paper §5.1) is the configuration-class exemplar. During the rollout of an NVIDIA software bundle for GB200-based systems (Linux kernel 6.16), a build flag required to enable dmabuf support in NVSHMEM was inadvertently omitted, and inference workloads fell into crash loops. The application layer saw only a generic NVSHMEM initialization failure with no pointers. RDMATracer's syscall trace showed NVSHMEM's device-discovery path falling back to the proprietary nv_peer_mem mechanism instead of the expected dmabuf path, and nv_peer_mem did not support the IBGDA capability NVSHMEM required on this hardware. That kernel-side divergence pinned the root cause to the missing build flag, a failure class that application-level signals cannot disambiguate in principle: the error was visible, the direction was not.
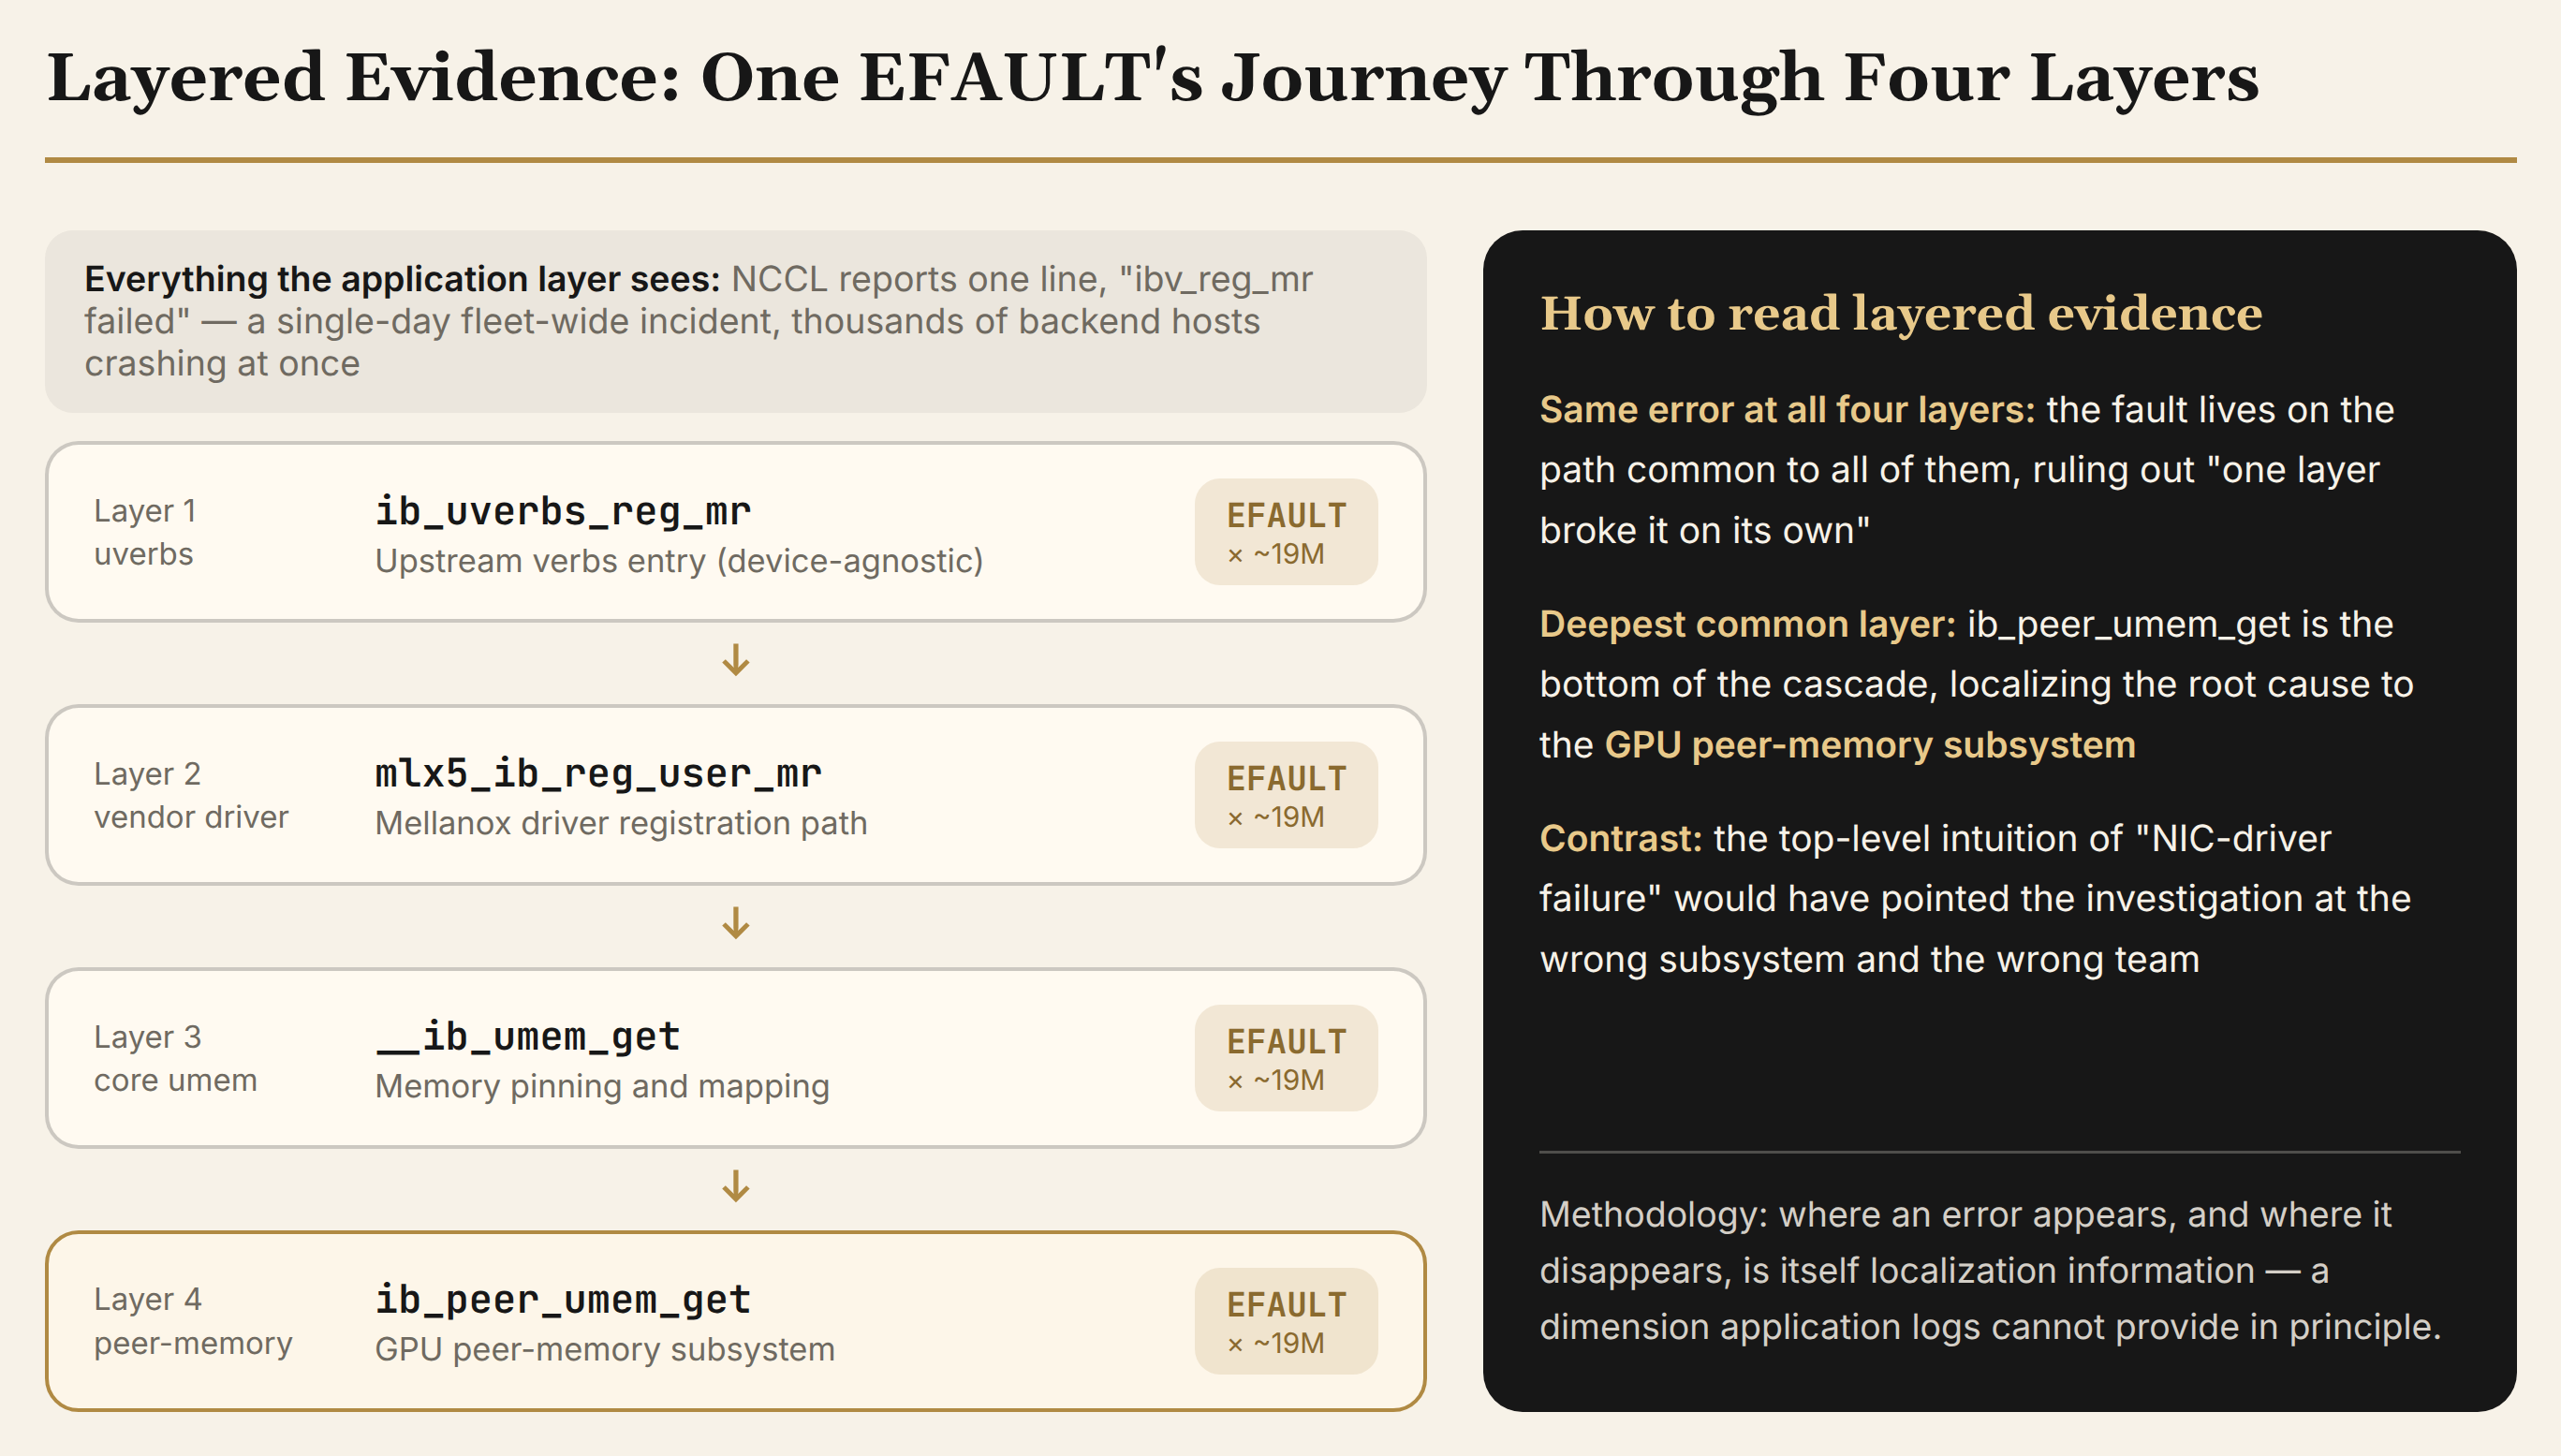
Case two (paper §5.2) is a fleet-wide incident. Within a single day, the memory-registration path ibv_reg_mr returned EFAULT ("Bad address") at high volume across thousands of backend hosts. NCCL surfaced only the top-level ibv_reg_mr failure. RDMATracer captured the same EFAULT at all four layers of the registration cascade (ib_uverbs_reg_mr, mlx5_ib_reg_user_mr, __ib_umem_get, ib_peer_umem_get), roughly 19 million occurrences at each layer. The same error at all four layers places the fault on a path deeper than the Mellanox driver; the layered evidence localized the root cause to the GPU peer-memory subsystem, decisively distinguishing it from a vague "NIC-driver failure."
The same team's LPC 2025 and FOSDEM 2026 talks added two cases the paper does not include; the details below follow the talk slides. In one, after a new vendor NIC driver was deployed, NCCL reported ibv_reg_dmabuf_mr returning EPERM (Operation not permitted); RDMATracer's exported syscall chain and return-value mismatch localized an overflow defect. In the other, the project's founding case, ibv_reg_mr returned ENOMEM, looking exactly like memory pressure but in fact caused by a 64-bit-to-32-bit integer conversion bug in vendor closed-source code; a later incident with the same symptom had an entirely different cause, in the interaction between the GPU driver and the huge-pages configuration. Same error, different root causes: a precise measurement of the information ceiling of application logs without kernel-side evidence.
The talks also disclosed a mechanism the paper's page limit left out: periodic auditing against "good traces." The system periodically captures and archives traces of calls that return success and complete within 50 ms; when a failure appears, good and bad traces are compared to find the bifurcation point. The challenge is "expected errors": some failures are normal (ENOENT from querying a disabled feature), and the baseline must learn not to treat them as anomalies. This baseline is not yet automated; extending the probe set as the kernel evolves still relies on manual auditing, which both the paper and the talks flag as an explicit future direction.
6. Industry Coordinates: A Four-Layer Observability Stack and Two Convergence Lines
RDMATracer is not an isolated case. On the industry observability map it has precise coordinates: a four-layer stack taking shape, with two clear lines of technical convergence.
The framework layer: the black-box pattern is settling in. PyTorch's Flight Recorder is this layer's flagship. It builds one CPU-side ring buffer per rank inside the c10d communication layer. Shared across process groups, it records for every collective and point-to-point operation the start and end times, the CPU enqueue time, the process group, the source and destination ranks, tensor sizes, and stack traces. An NCCL watchdog timeout triggers an automatic dump to storage.
Collection has been available since PyTorch 2.4, and the Llama 3 training report used it. The TorchTitan paper (arXiv:2410.06511) lists it as a production-pretraining staple, aimed squarely at collective hangs. Pipeline-parallel schedule defects and ranks that never enter a collective are localized simply by aligning records across ranks.
The companion fr_trace tool aligns every rank's records by sequence number, aggregates them per process group, and enumerates the mismatches: missing ranks, state disagreements, divergent call stacks. Each mismatch then maps to a root-cause category: CPU-side stuckness, slowness, or cross-rank divergence; a hung GPU compute kernel; misconfigured collective arguments; or network and hardware faults. In March 2026 the official PyTorch blog laid out the full methodology, and at @Scale in June that same year the team demonstrated LLM agents sitting on top of the Flight Recorder, automating the cross-rank telemetry analysis. The bridge from mismatch to code-level root cause is being handed to models.
Set against RDMATracer, an orthogonal relationship emerges. In the same NCCL crash, Flight Recorder answers "which rank fell behind in which collective," while RDMATracer answers "which kernel layer's syscall failed." One aligns the rank dimension, the other the call-depth dimension. Only together do the two evidence lines assemble the full failure scene.
The kernel layer: generic and specialized eBPF. The same-problem tool on the kernel side is retsnoop, by Andrii Nakryiko, a Meta distinguished engineer and eBPF Steering Committee member. Its founding motivation matches RDMATracer's: a generic error like -EINVAL returned from deep inside a complex syscall, with no easy way to guess its origin. By default it captures only call stacks that end in an error code or NULL and reaches for the deepest frames; Kernel Recipes 2024 devoted a talk to it.
retsnoop proves this problem shape has a generic solution. RDMATracer proves that on a production fleet of tens of thousands of hosts, the generic solution yields to domain specialization: 13 curated probes, emit-on-failure, dual-plane export, each one a cost reduction bought with RDMA domain knowledge. Both author groups sit inside Meta, two routes to the same problem, which partly explains why this paper came from there.
The broader eBPF observability ecosystem is spreading horizontally. Tetragon and Pixie cover Kubernetes security observability and generic tracing (the paper's related-work section already positioned them). On the continuous-profiling line, Parca and Grafana Pyroscope sample every process on a host via eBPF with zero application changes, holding steady-state overhead to roughly the 1% level.
OpenTelemetry is bringing an eBPF profiler into the standard pipeline, with profile data flowing over OTLP straight into Pyroscope, and a dedicated CNCF working group pushes the standardization. The generic ecosystem covers any process, any container, any cluster, but no generic solution models a subsystem's failure semantics for you. RDMATracer's four heuristics have no counterpart on the generic platforms, and that is exactly the specialized layer's room to live.
The network and hardware layer: vendors commoditized observation. NVIDIA's Mission Control, delivered since GTC 2025, is the reference point: an integrated software stack for AI factories whose telemetry component parallelizes collection across thousands of GPUs, Spectrum-X Ethernet and Quantum InfiniBand switches, and NVLink switches. Driven underneath by UFM and NMX, it carries the official framing of always-on resilience plus an autonomous recovery engine. Observability vendors such as Dynatrace followed, writing full-stack monitoring into NVIDIA AI Factory deliveries from GPU to Kubernetes to inference services, making observation itself a selling point of the AI factory.
Network-side telemetry (RoCE congestion signals, switch counters) we unpacked in our MetaRoCE deep dive and will not repeat here. The vendor stack's sight ends at its own hardware boundary; cross-layer failures, like the interaction between kernel drivers and GPU peer memory, still need system-level probes of the RDMATracer kind.
The algorithm layer: from regex to execution replay to agents. The diagnostic-algorithm lineage falls into four generations. The first is rules and regex: ALPS, unpacked in Section 4, buckets NCCL logs with curated regexes, fast and interpretable, at the price of roughly 25% mislabeling. The second is structured alignment and enumeration: fr_trace aligns across ranks by sequence number, and the mismatch is the clue; RDMATracer's layered evidence (where an error appears, where it disappears) applies the same idea along the call-depth dimension.
The third is execution replay and causal inference: Anduril (SOSP 2024) combines static causal analysis with feedback-driven search to locate root causes in the fault space and reproduce them by injection. It reproduced all 22 real-world faults across five large-scale distributed systems. ExChain (NSDI 2024) does exception dependency analysis, and DejaVu (FSE 2022) performs executable localization of recurring failures, moving diagnosis from reading data to replaying causality.
The fourth is agentization: LLM agents plugged into the Flight Recorder pipeline, automating the cross-rank analysis, the 2026 development mentioned above. The premise of this entire line is that the collection side first hands over structured evidence. Without sequence numbers in ring buffers and return values in failure records, any algorithm can only spin on unstructured logs. The second half of the observability stack's competition is over evidence formats.
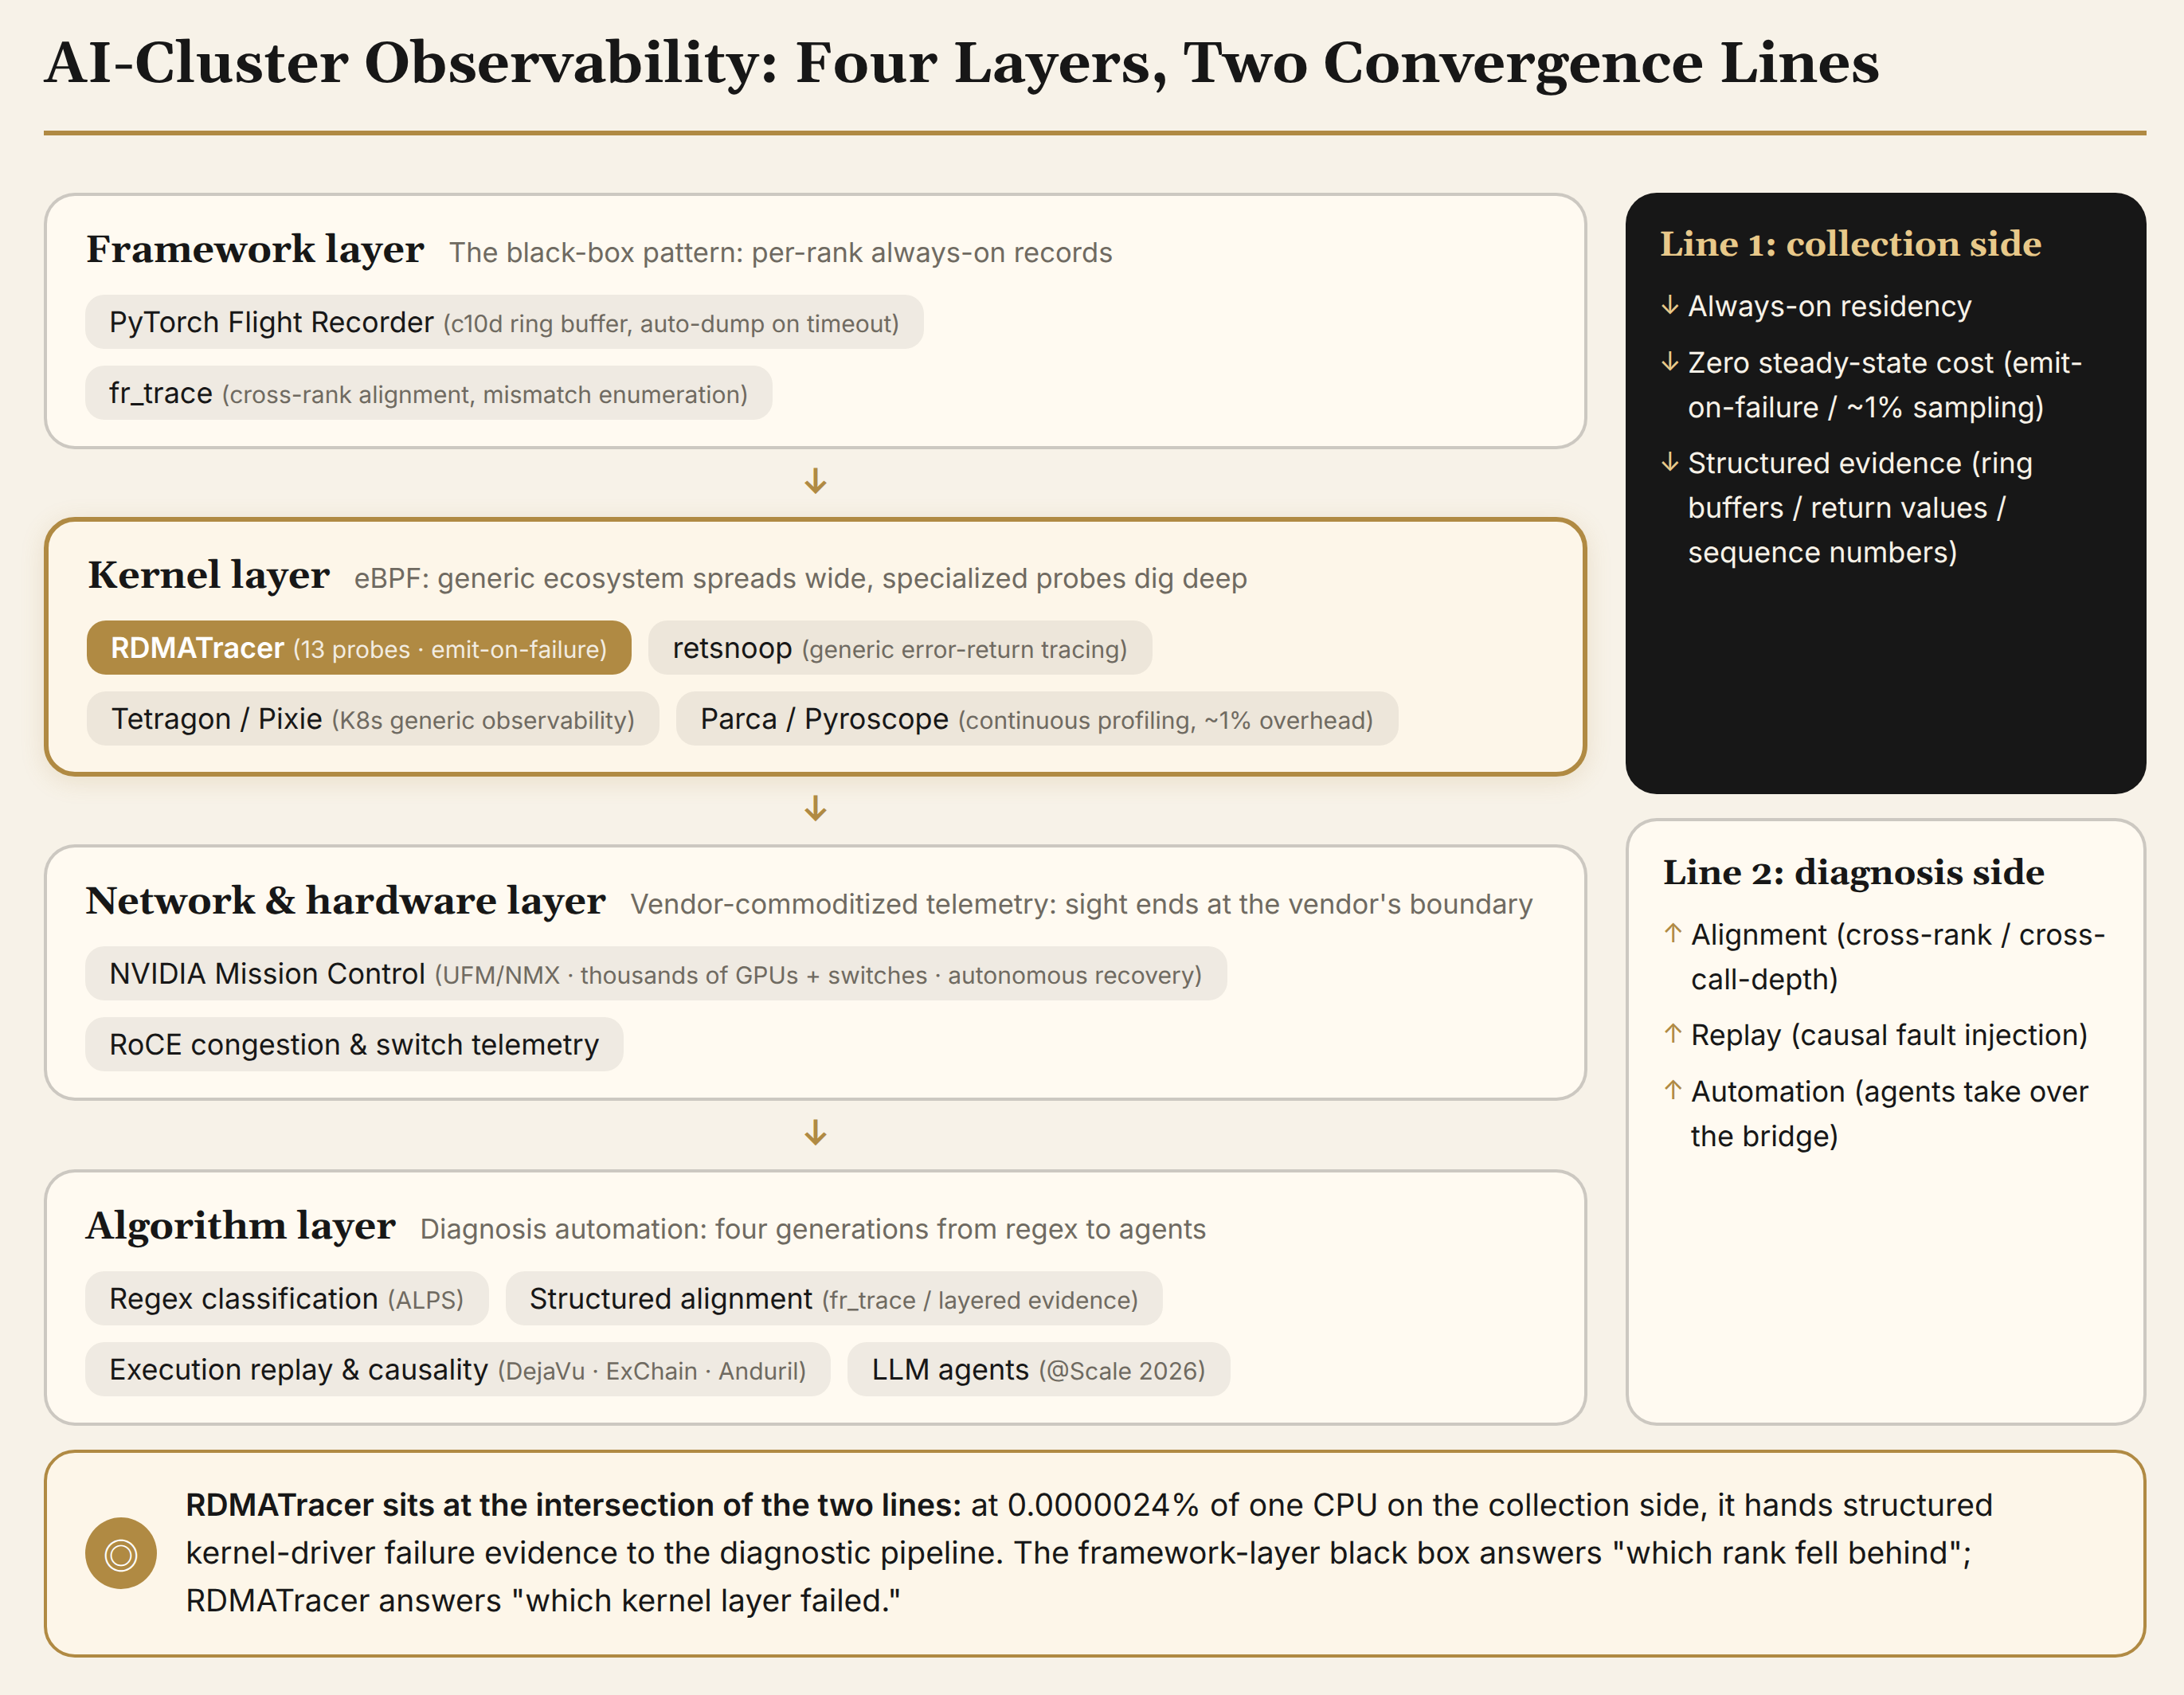
The four-layer stack compresses to one sentence: the framework layer has its black box, the kernel layer has eBPF, the network and hardware layer has commoditized telemetry, and the algorithm layer is moving from rules toward agents. The two convergence lines are equally visible: collection heads toward always-on, zero steady-state cost, and structured evidence; diagnosis heads toward alignment, replay, and automation. RDMATracer sits precisely at the intersection of the two lines, connecting the kernel driver layer into this pipeline at a cost of 0.0000024% of one CPU.
7. The Bigger Picture: Where the Floor of AI-Cluster Observability Lies
Placed back in industry context, RDMATracer matters beyond one internal Meta tool.
The floor of observability has been pushed down to the kernel driver layer. Over the past two years, AI-cluster observability has been built at the two ends: the application-and-framework side has structured records like PyTorch flight recorders and NCCL debug logs; the network side has switch telemetry and port counters; the hardware side has GPU monitoring like DCGM. The paper's introduction states it precisely: existing diagnostic tooling aims either at high-level frameworks or at low-level hardware telemetry, leaving kernel driver execution paths as the gap in between.
RDMATracer proves the gap can be closed with a two-digit number of probes at roughly 0.0000024% of a CPU. For any operator above ten-thousand-GPU scale, this is a directly reusable recipe: curated probes, emit-on-failure, batched export, good-trace baselines. Apart from 2 OFED-derived hooks requiring path-specific replacement on vanilla kernels, everything fits within the eBPF capability shipped in a Linux distribution.
"Observability-first" is the phrase more worth remembering than the tool. The paper's abstract describes its contribution as not just a tracer but an "observability first pipeline" enriching kernel records with additional user-space context. Translated into operational language: first guarantee that kernel evidence of the failure scene is preserved always-on, then worry about correlating it with jobs, models, and team workflows. That is a directional break from the old reproduce-with-a-tracer paradigm. What the 6 pages leave out, the enrichment pipeline's details and the analysis layer above Scuba, itself marks the priority: evidence collection is the foundation, and the foundation sets the response speed of every analysis above it.
The divide between generic eBPF observability and subsystem specialization will persist. The related-work section positions the generic camp clearly: Tetragon's TracingPolicy performs in-kernel filtering at kprobe/tracepoint/uprobe hooks, including matching on return values, but it targets Kubernetes security observability and runtime enforcement rather than deep modeling of any kernel subsystem. RDMATracer's value lies precisely in the non-generic part: the four heuristics are RDMA domain knowledge (the QP/MR/PD/CQ object model, the relationship between cleanup paths and panics, the verbs-versus-vendor-driver layering), and both the 73% coverage validation and the cross-vendor namespace gate stand on that knowledge.
The judgment generalizes: every performance-critical kernel subsystem with complex failure semantics, storage stacks, GPU drivers, perhaps CXL next, deserves a specialized observation path, while the generic platforms' role is to orchestrate such probes safely.
The list of blind spots remains long. The boundaries the paper draws for itself deserve respect. RDMATracer covers only the control path; data-plane failures have their own blind spots: a QP transitioning to error state may be reported only to user space, leaving no kernel trace. The FOSDEM talk notes these require moving to uprobes, and user-space instrumentation faces its own battle with inlining.
The 13 probes need ongoing maintenance as kernel versions evolve; automating the good-trace baseline and the probe-set extension remains unfinished. One data caveat: the paper's failure taxonomy is built on Meta's own production-cluster telemetry, a 5-month window, and regex bucketing. The magnitudes are credible, but boundaries, like the width of that 4–15% range, will shift with cluster shape and software-stack version. Budgeting your own cluster directly off Meta's numbers deserves caution.
Summary and Judgment
This six-page workshop paper proposes no new algorithm and no new system paradigm. What it does is take a class of failures the entire tooling ecosystem missed, RDMA syscall failures, from invisible to always-on visible, and put costs and benefits on the table with verifiable numbers (73% retrospective coverage, 0.0000024% of a CPU, a billion captured entries). The companion LPC and FOSDEM talks supply the engineering detail the paper omits, and three sources interlock. That is a healthy publication shape for an industrial-systems paper.
Three judgments.
First, the kernel driver layer will become the next battleground of AI-cluster observability. Application-layer and network-layer observation have commoditized; the bottleneck of fault attribution is shifting to the middle layer. RDMATracer's 96% no-accompanying-signal and 25% misattribution say that whoever closes this layer first cuts off an entire class of mobilizations misrouted from the start. The HPCA 2025 cluster-reliability study points the same way from the failure-statistics side; two lines of evidence are converging.
Second, "curated probes + emit-on-failure" will become the default shape of kernel observation. At fleet scale, full tracing losing to structured pruning is a cost inevitability. RDMATracer's reduction from 2,000 to 13 proves that domain knowledge is the moat of an observability system. The pattern does not depend on Meta's infrastructure scale; SRE teams on small and mid-sized clusters can adopt it directly.
Third, cross-vendor driver observation needs an upstream standard. Eleven of the 13 probes are portable thanks to the layered uniformity of the verbs core and the ib_device_ops interface, but the path-specific replacement of 2 OFED-derived hooks is a reminder that observation capability is still partially bound to the world outside distribution kernels. If the RDMA core community standardizes verbs-layer observation points as stable tracepoints, the maintenance cost of such systems drops another notch: paper and talks both name probe maintenance under kernel evolution as an explicit future direction, and the directions agree.
Three things to watch next. Whether Min Si et al.'s Collective Communication for 100k+ GPUs (arXiv:2510.20171), once landed, drives observability requirements upward from hundred-thousand-GPU collective-communication failure semantics; whether eBPF progress on uprobes and inline-function tracing brings the RDMA data-plane blind spot into the always-on fold; and NAIC itself. The top-conference ecosystem treating AI-infrastructure operability as a first-class topic, with production-systems papers like this one appearing steadily, says more about AI clusters' engineering center of gravity shifting to reliability than any benchmark could.
All facts in this article come from the RDMATracer paper (NAIC '26, DOI 10.1145/3789240.3828742) and the authors' LPC 2025 and FOSDEM 2026 talk materials; the industry-coordinates section (Section 6) draws additionally on public sources including the official PyTorch blog, @Scale 2026 talk materials, the NVIDIA developer blog, and SOSP/NSDI/FSE papers. Each figure's provenance is labeled in the text; data compiled as of September 8, 2026.