
2026-08-25 · Report dissection · Follow-up to our Groq 3 LPX production analysis (AgentX is the workload behind that piece's 30×/35× numbers)
Three million dollars' worth of data, given away free.
On August 24, during Hot Chips week, SemiAnalysis released InferenceX v3 and the AgentX 1.0 benchmark, and open-sourced 393 anonymized sessions drawn from its trace corpus (8,300 sessions, 3.4 million requests, 610 billion tokens, all of it real work). The scoreboard from 1,000-plus chips and 70-plus upstream optimization PRs went public too. Everything, that is, except the answer to the title question: does the CUDA moat hold up in agentic inferencing? The paywall cuts before the conclusion, and the free body ends with "the community has the opportunity to draw their own conclusions."
The data is theirs; the judgment can be ours. The first four sections dissect AgentX 1.0 as an engineering object: how the dataset is built, how the replay resists gaming, how the metrics are defined, and what the measurements expose. The last three give the landscape, our answer on the moat, and the power structure this benchmark is quietly rewriting.
One: Dissecting the Dataset, Where 393 Trajectories Come From
A benchmark's credibility ceiling is set the moment its data is captured. AgentX's answer: only real work.
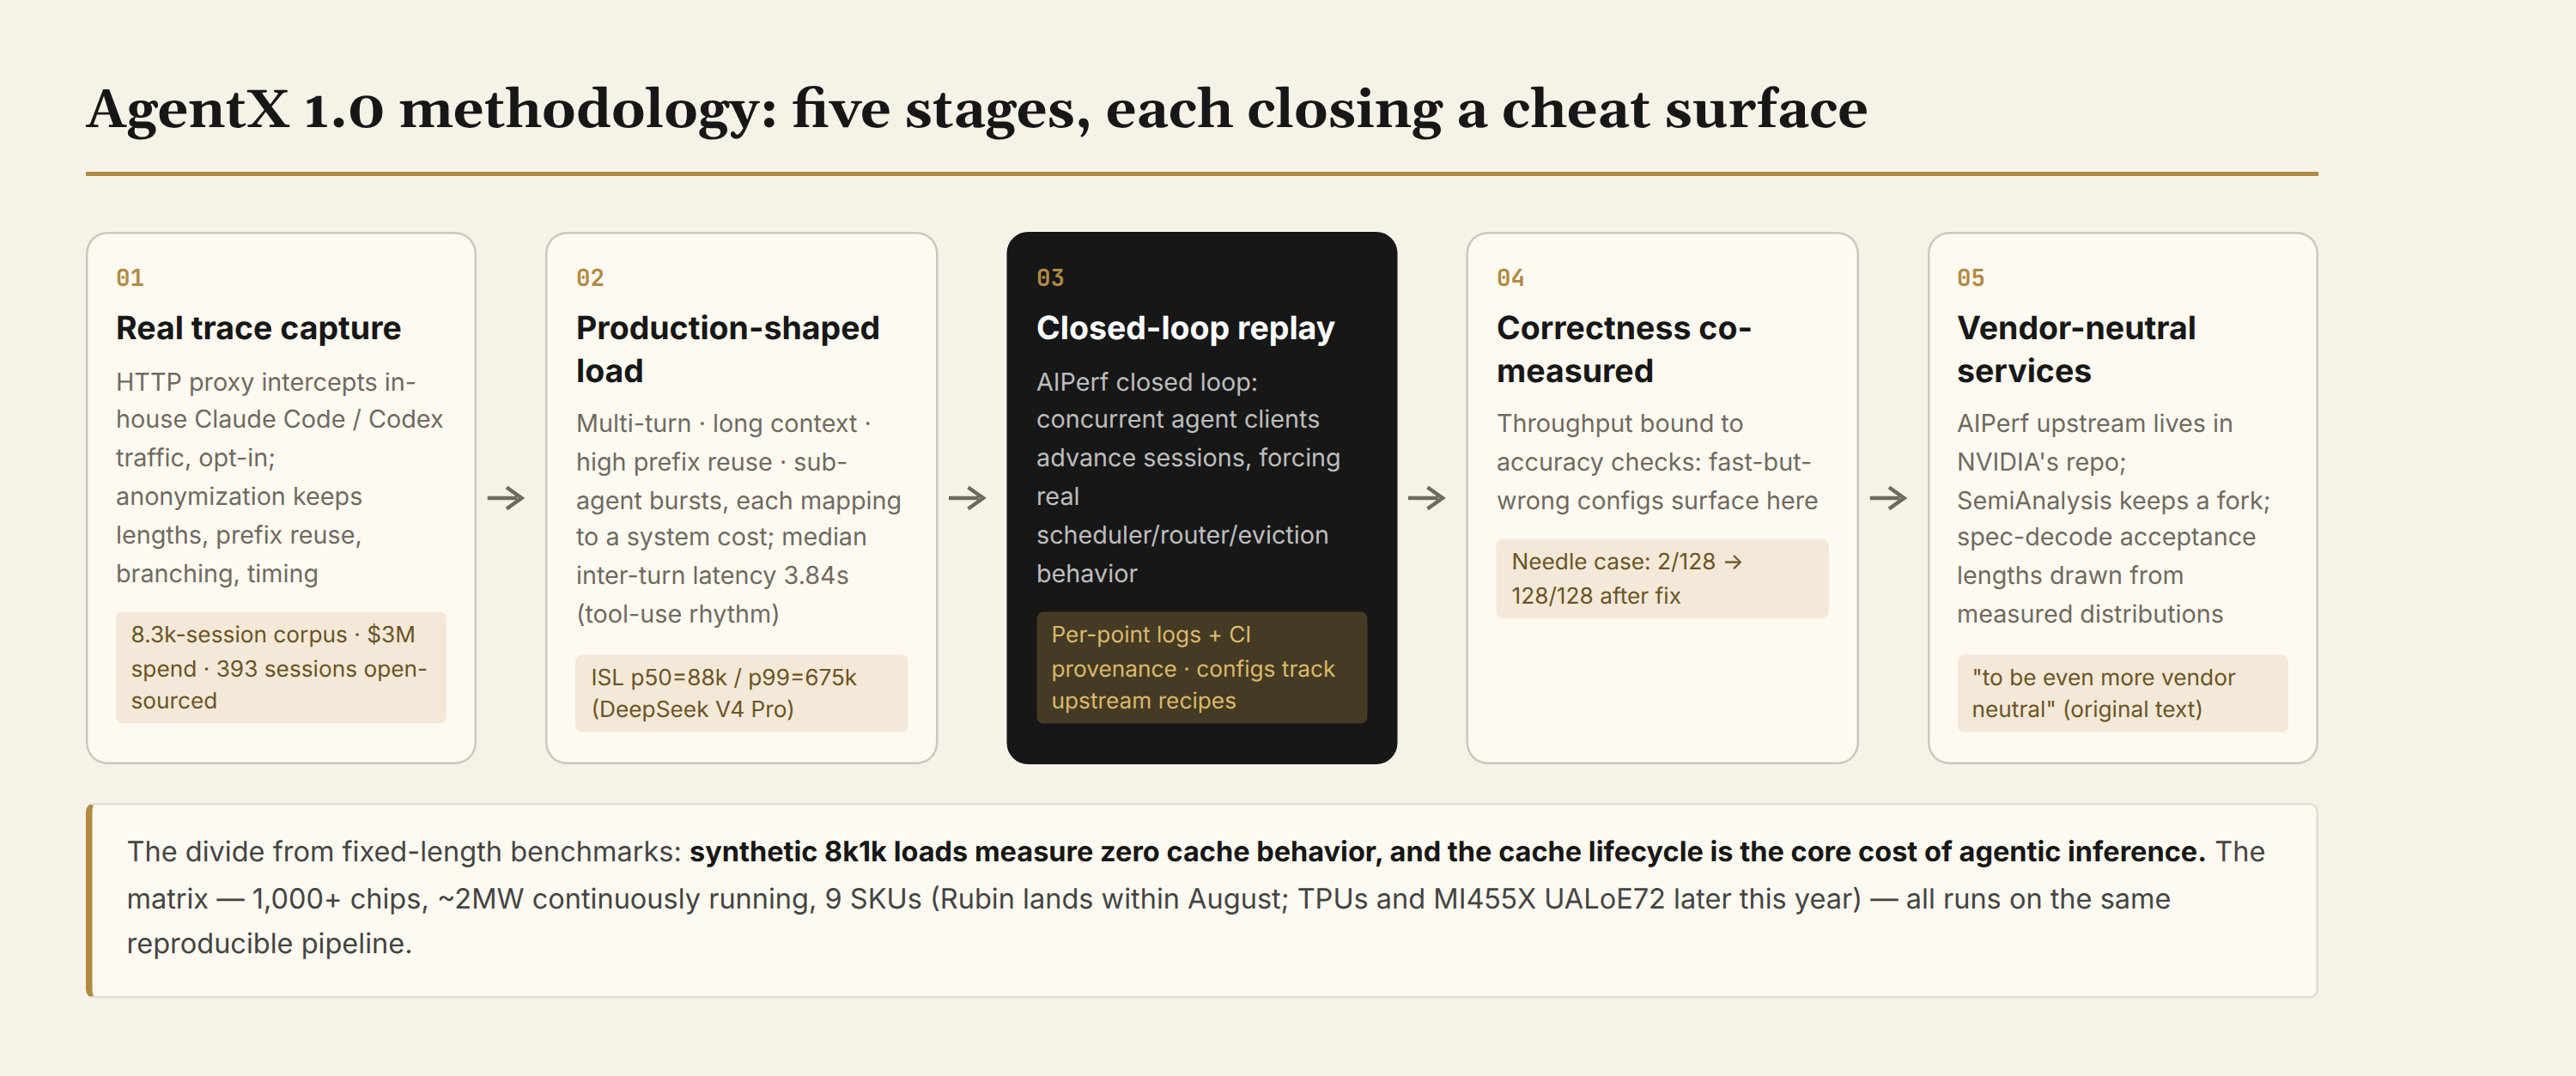
The capture layer. The SemiAnalysis team runs coding agents heavily in-house, and an HTTP proxy intercepts their own Claude Code and Codex traffic: participants change a base URL, and the proxy records request and response timing, token counts, conversation IDs, and sub-agent IDs. As of writing, the corpus holds 8,300 sessions, 3.4 million requests, and 610 billion tokens — over $3 million at API prices. This capture method defines the data's purity: everything comes from real work; not a single request was born for the benchmark.
Cleaning and eligibility. The open-sourced subset's entry bar sits on the InferenceX methodology page: at least 20 requests per session, Claude Code 2.1.139 or newer, no more than 10 concurrent sub-agents. Cleaning removes Claude Code's security-monitor requests (auto-mode automatic calls) and title-generation calls, deduplicates (a dropped connection can deliver duplicate requests to the proxy), and discards reconstructed inputs above 990k tokens (trimmed against the 1M ceiling). The 393 sessions are what survives three filters.
The shape of the distributions. After cleaning: input length median 142k tokens, output median 444, inter-turn latency (mostly tool execution time) median 3.84 seconds, with only ~10% of inter-turn gaps above one minute, likely the harness waiting on a human. All three distributions are roughly log-normal, and 44% of the 393 sessions contain sub-agents. The shape carries a lot of information: read-heavy and write-light (input is 320× output), and tool-call rhythm sits at seconds, not milliseconds. The benchmark's waiting windows are therefore part of the load itself: the serving scheduler must hold a session's cache through the pause.
An honest caveat. The report notes explicitly that distributions shift with the harness and the model: Pi is known for minimal injected context, Claude Code for the opposite; tokenizers differ too. In other words, this dataset portraits "the Claude Code family of workloads"; extrapolate to all agentic settings with a discount. The report doesn't dodge this.
The cost of anonymization, and its patch. Anonymization replaces content payloads with 64-token hash blocks, which must be synthetically refilled before replay: AIPerf fills them by deterministic sampling from a synthetic coding/tool-use token pool. Request lengths, KV-reuse patterns, and timing are preserved exactly; the content is fake. That has a technical knock-on: a speculative-decoding draft model has never seen synthetic data, so its acceptance rate distorts. SemiAnalysis's fix comes in the next section.
Two: Dissecting the Replay Engine: Closed Loop, Anti-Gaming Markers, Speculative-Decoding Fairness
Closed-loop replay. AgentX uses AIPerf (upstream in NVIDIA's ai-dynamo repo; SemiAnalysis keeps a fork "to be even more vendor neutral") for closed-loop replay: concurrent agent clients each advance their sessions, and faster configurations complete more requests, meeting a slightly different workload mix. Every datapoint ships with full logs, accuracy validation, and GitHub Actions CI provenance. Open-loop replay feeds a fixed request stream; closed-loop replay lets the serving system's scheduling decisions shape the subsequent load. That is the essential difference between production and stress tests.
The cache-bust marker. This is the most elegant stroke in the replay design. When a session finishes during replay, its replay lane takes the next conversation from the sampler. If different replays happened to reuse the same sessions, cache hit rates would be artificially inflated. The fix: each replay gets a unique deterministic marker prepended to the head of every independent prefix chain (main-agent chain, fresh-context sub-agent chains, one-off chains), and forked sub-agents inherit the marker from their parents. Within a replay the marker stays constant (preserving KV-reuse patterns); across replays it always changes (preventing fake hits). This also lets concurrency exceed the 393 sessions: the same conversation can run in multiple lanes, with markers ensuring they never gift each other cache.
Speculative-decoding fairness. The knock-on from the last section gets resolved here: synthetic data distorts spec-decode acceptance lengths. SemiAnalysis worked with the community to expose a "forced acceptance length" interface in most open-source engines; then, for each model, they measured the acceptance-length distribution on real data using NVIDIA's SPEED-Bench and force-apply that distribution at replay. Engines with strong spec decoding can't profit from synthetic accidents, and weak ones aren't slandered. This layer of fairness engineering is rare in public benchmarks.
Configuration discipline. Benchmark configs track the upstream recipes.vllm.ai and SGLang cookbook images: measuring the stacks customers actually run, sidestepping benchmax-tuned images. The vendor-neutral posture runs all the way down to engineering detail.
Three: The Metrics: Three Axes, TCO Normalization, One Honest Experimental Number
AgentX hangs results on three axes: per-user interactivity (output tokens per second, the inverse of TPOT), p90 TTFT, and system throughput. The three trade against each other. The official rendering is the throughput×interactivity Pareto curve with TTFT as a third-axis check (high-throughput points with exploded TTFT get called out). Cross-hardware comparison uses TCO-normalized perf-per-dollar and throughput per megawatt — in 2026's compute economics, power constraints sit at the same table as money.
The report also introduces an experimental metric: E2E Normalized Interactivity, defined as OSL/E2EL (output length over end-to-end latency). Substituting E2EL = TTFT + OSL×TPOT, the metric works out to interactivity itself plus a penalty proportional to TTFT, an attempt to compress "first token fast" and "all tokens fast" into one number. The report's own attitude deserves quoting: "this metric is experimental and is not perfect. It heavily penalizes high TTFT and doesn't capture all the nuances of certain optimizations such as PD disaggregation."
One number cannot hide everything a multi-turn session does, so the visualization layer was rebuilt too: behind each Pareto point are thousands of requests across conversations, warmup periods, cache-state migrations, and dynamically shifting in-flight load, all drillable. That telemetry is itself the incubator of the seventy-plus upstream PRs: the first step of optimization is making the problem visible.
Four: Five System Lessons in KV-Lifecycle Engineering
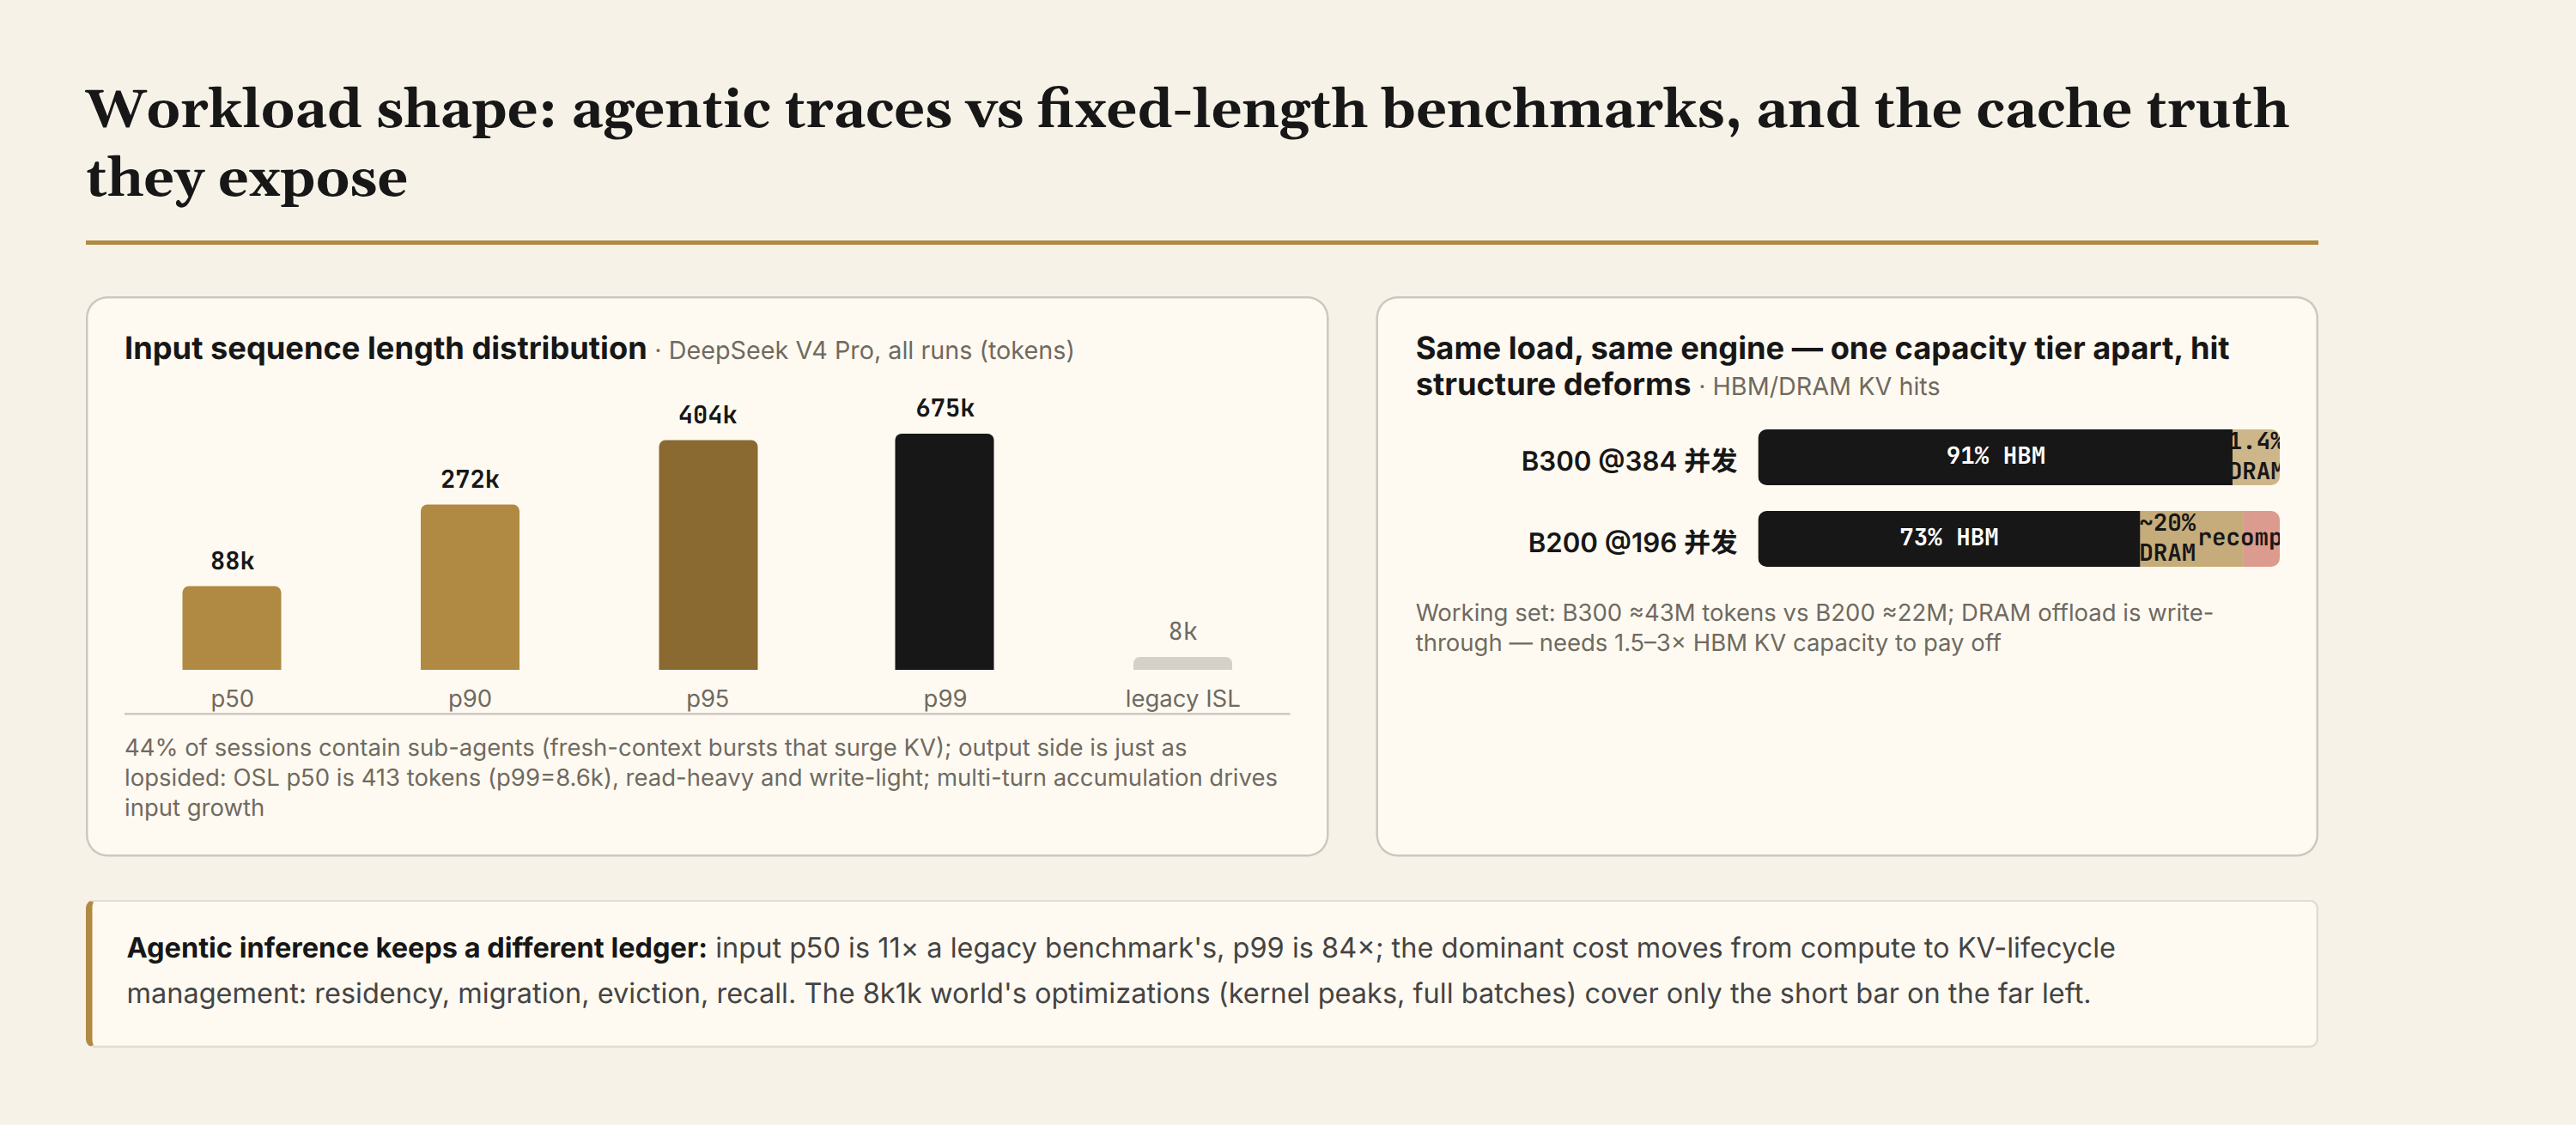
Pouring 393 real trajectories through a thousand-plus chips yields a first-layer finding that has nothing to do with chips and everything to do with state management. The five lessons chain through cause and effect: cache hits decide cost, routing decides hits, architecture decides what can be kept, multi-turn decides what taxes remain, and the scheduler referees at the end.
Same load, same engine, same decode path: B300 hits cache 91% of the time, B200 only 73%. Two chip generations, two different faces, and the reason is not compute. At 384 concurrency the B300's KV working set is ~43M tokens; it fits, so it hits (another 1.36% lands in DRAM). The B200's working set is ~22M tokens; what doesn't fit, nearly 20%, must go through DRAM offload, and the latency curve deforms with it. DRAM offload is also write-through (every prefix written to HBM also goes to DRAM), and only pays when DRAM is 1.5–3× HBM KV capacity. Lesson one: cache hit rate is the first-order productive force, capacity shapes the hits, and "how much memory to buy" is now a cache-economics problem.
With hits established, the next question is where requests go. Under data-parallel attention each rank holds a private cache; dispatch a 300k-token session to a rank that lacks its prefix, and what is the price? Full recomputation. The measured DP-attention cache hit was 28.8% against a 96% theoretical; the gap is the routing tax. Cache-aware routing (session stickiness, consistent hashing) graduated from optional to mandatory, with patches landing across four routers: vLLM router, llm-d, SGLang model gateway, and ATOMesh. Lesson two: routing must know where state lives.
Routing can protect KV, but the new model generation brings a kind of state routing cannot protect. Qwen3.5's GDN (gated DeltaNet from MIT/NVIDIA research, constant state footprint), MiniMax's sparse attention, and Kimi's conv+SSM layers all introduce recurrent state beyond the KV cache. Its physics invert KV's: a sliding-window tail can be recomputed from neighboring tokens; lost recurrent state can only be recovered by replaying the entire sequence. Both engines rebuilt their offload layers for it: SGLang's HiCache uses an asymmetric policy (offload only the expensive full-attention cache; reconstruct the window tail on the way back, since rebuilding beats fetching); Kimi K3 disaggregation must carry conv+ssm state alongside KV over MoRI-IO, or the decode side starts from uninitialized state. Lesson three: hybrid architectures bring unreconstructable state.
With state settled, each turn's fixed costs come into view. Every turn re-sends the full history, and naive implementations re-tokenize the same 100k tokens repeatedly. The "obvious" fix — tokenize only the new suffix — is wrong: BPE merges can span the boundary, and failing to roll back one complete token at the split point forks the sequence. TensorRT-LLM's boundary-aware scheme matched full tokenization on all 1,087 transitions in the Qwen3.5 trace, taking mean time from 185.1ms to 11.3ms. Sibling taxes: the serialization of re-sent request payloads each turn (Dynamo's switch to MessagePack: +8.1% throughput, −9.7% TTFT; the per-token cost of streamed frames was instead handled by the later zero-copy series), and a per-step device-to-host length sync in the scheduler (deleting it removed a decode bubble). Lesson four: multi-turn loads carry taxes single-shot loads never see.
With the point costs cleared, the scheduler remains as referee, and the referee has an invisible hand. Under DP attention, every rank schedules attention locally but joins the global MoE collective; a rank fed continuous prefill keeps winning the prefill-first decision while peer ranks' decode batches wait. SGLang added a configurable decode interval — forced decode rounds between prefills — and on DeepSeek V4 Pro output throughput rose 141% with p99 inter-token latency down 97.3%. The cost, in numbers: median TTFT rises from 36.5 to 59 seconds. Lesson five: scheduling stopped serving free lunches; it now serves explicit trade-offs.
Walking the chain end to end, the five lessons point to one judgment: agentic inference's bottleneck has moved from the kernel layer up to state management. The largest batch of the seventy-plus upstream PRs touches exactly these — cache survival, transfer granularity, routing ownership. The report's back half is, in effect, a field manual of KV-lifecycle engineering.
Five: The Scoreboard, in Three Layers
All five frontier open-weight models come from Chinese vendors (DeepSeek V4 Pro, Kimi K3, GLM 5.3, MiniMax M3, Qwen3.5), and four of them appear on the supporter list. The scoreboard has three layers.
The NVIDIA-dominant zone. On GLM 5.3 (SGLang stack, the 150 tok/s/user tier), NVIDIA's cost efficiency leads by up to 5×; the report's phrasing: the advantage is so large that "even if the competitor chip hardware was sold for free (with providers still paying for datacenter hosting and power and other operating costs), cost per token would still be cheaper when using Nvidia." On Qwen3.5 (the 90 tok/s/user tier) the SGLang stack leads by more than 20× with zero AMD submissions; on the same model, B300 FP4 delivers 12× the perf-per-dollar of H100. On MiniMax M3 the report is blunter: "Nvidia absolutely destroys all competitors," with the crown held by TensorRT-LLM TP2 on B300.
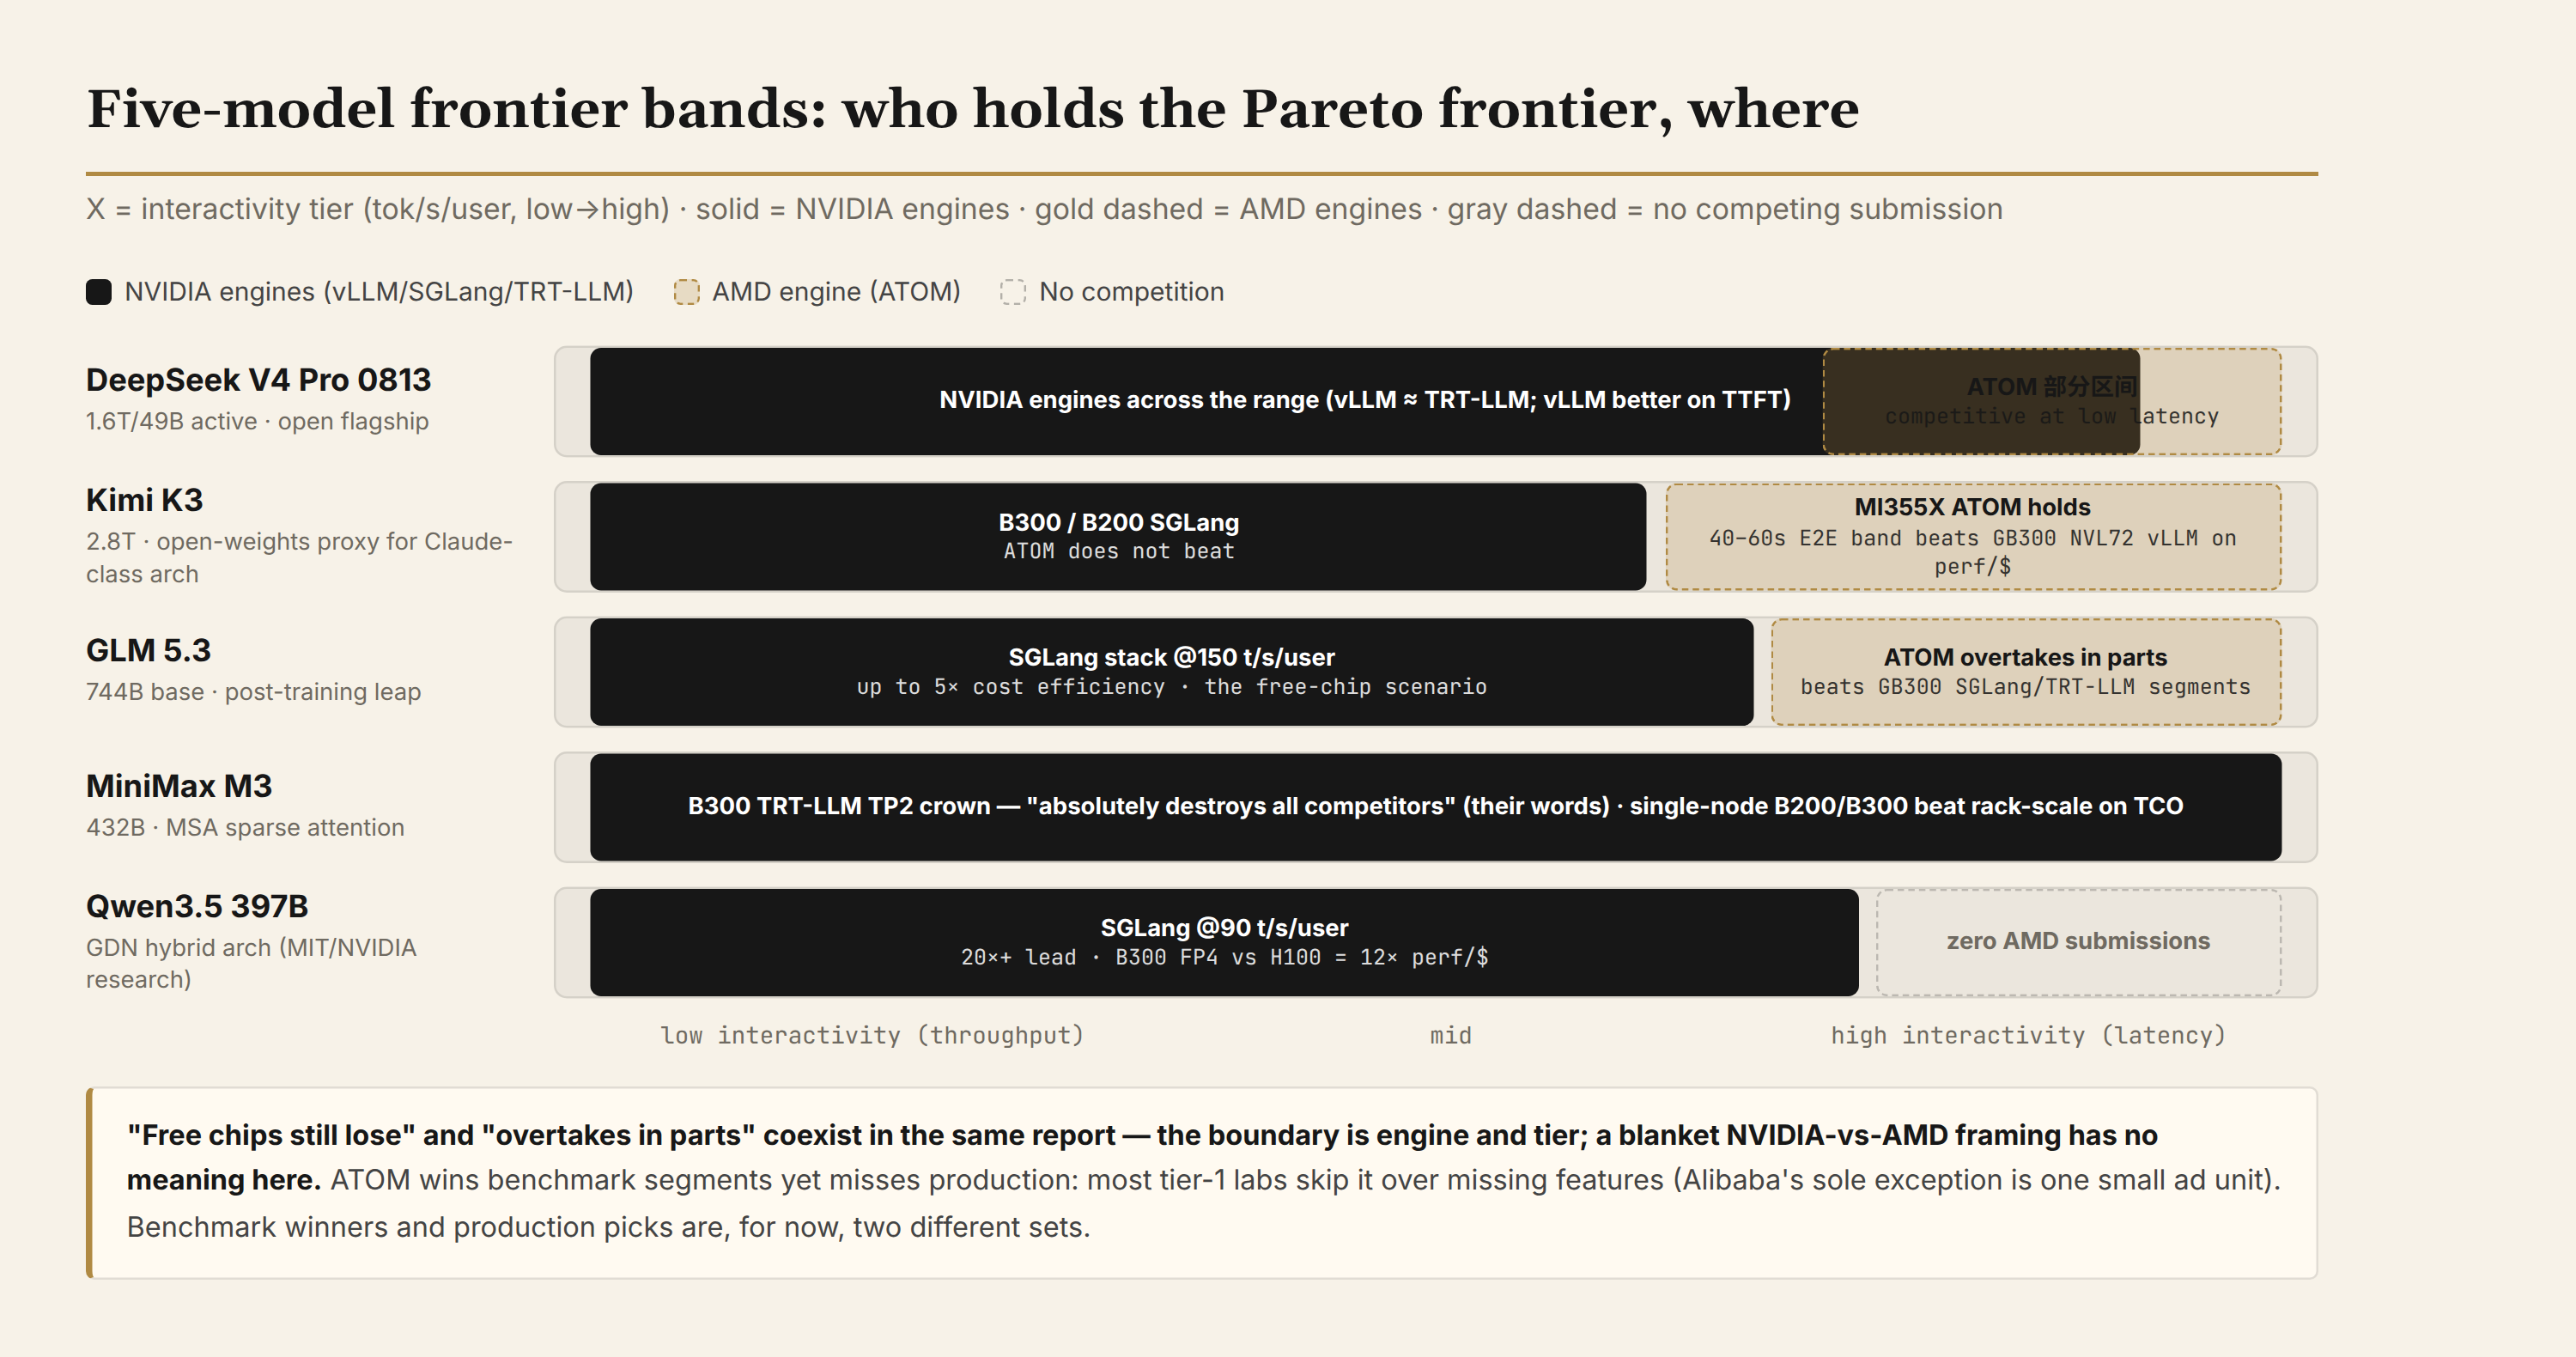
The AMD highlight zone. On Kimi K3, MI355X with the ATOM engine beats GB300 NVL72's vLLM on price-performance in the 40-to-60-second end-to-end latency band; on GLM 5.3, ATOM also beats GB300 NVL72's SGLang and even TensorRT-LLM in parts of the range. There is also a structural advance: MiniMax M3's FP4 disaggregated deployment worked on day zero, whereas in the DeepSeek-R1 era AMD's parity took months. But the boundary is equally explicit: on end-to-end latency, ATOM beats B200 vLLM yet "does not beat B300 or B200 SGLang." Within one and the same report, "free chips still lose" and "overtakes in parts" coexist — the dividing line is engine and tier; a blanket NVIDIA-versus-AMD framing has no meaning here.
The system-level findings. The most piercing one: on MiniMax M3, single-node B200/B300 beat the rack-scale GB200/GB300 on TCO-normalized throughput — Dynamo's router overhead grows with the number and length of live prefixes, and the rack-scale advantage was partly eaten by its own orchestration layer. "Buy the rack" needs re-argumentation under this workload profile. Three more: the H200 veteran still holds value at low concurrency; context parallelism (PCP/DCP) currently sees zero submissions despite MiniMax traces reaching p90 input of 317k; and AMD's light use of CPU offload traces back to an absurdly specific API gap: hipMemcpyBatchAsync did not exist until ROCm 7.14, forcing serialized copies before then.
And one finding sits outside the scoreboard: ATOM wins benchmark segments yet cannot enter production. In the report's words, most AI labs in China and the West decline to run ATOM in production over missing features, with the sole exception of one small advertising business unit at Alibaba; the main Qwen organization does not use it either. Benchmark winners and production picks are, for now, two different sets.
Six: Our Answer: the True Form of the Moat
The report's free body does not answer its own title question. What follows is our synthesis; the material is the report's, the framework is ours.
What the report says outright: context-parallelism techniques were invented in part at Nvidia Research, AMD's implementations are unoptimized, and every AMD backend in vLLM's support matrix is unsupported — the original text says this "forms part of CUDA moat." On the open-source stack, AMD's long-context multi-turn gap is enormous. ATOM's performance gains are real, and its production adoption is stalled.
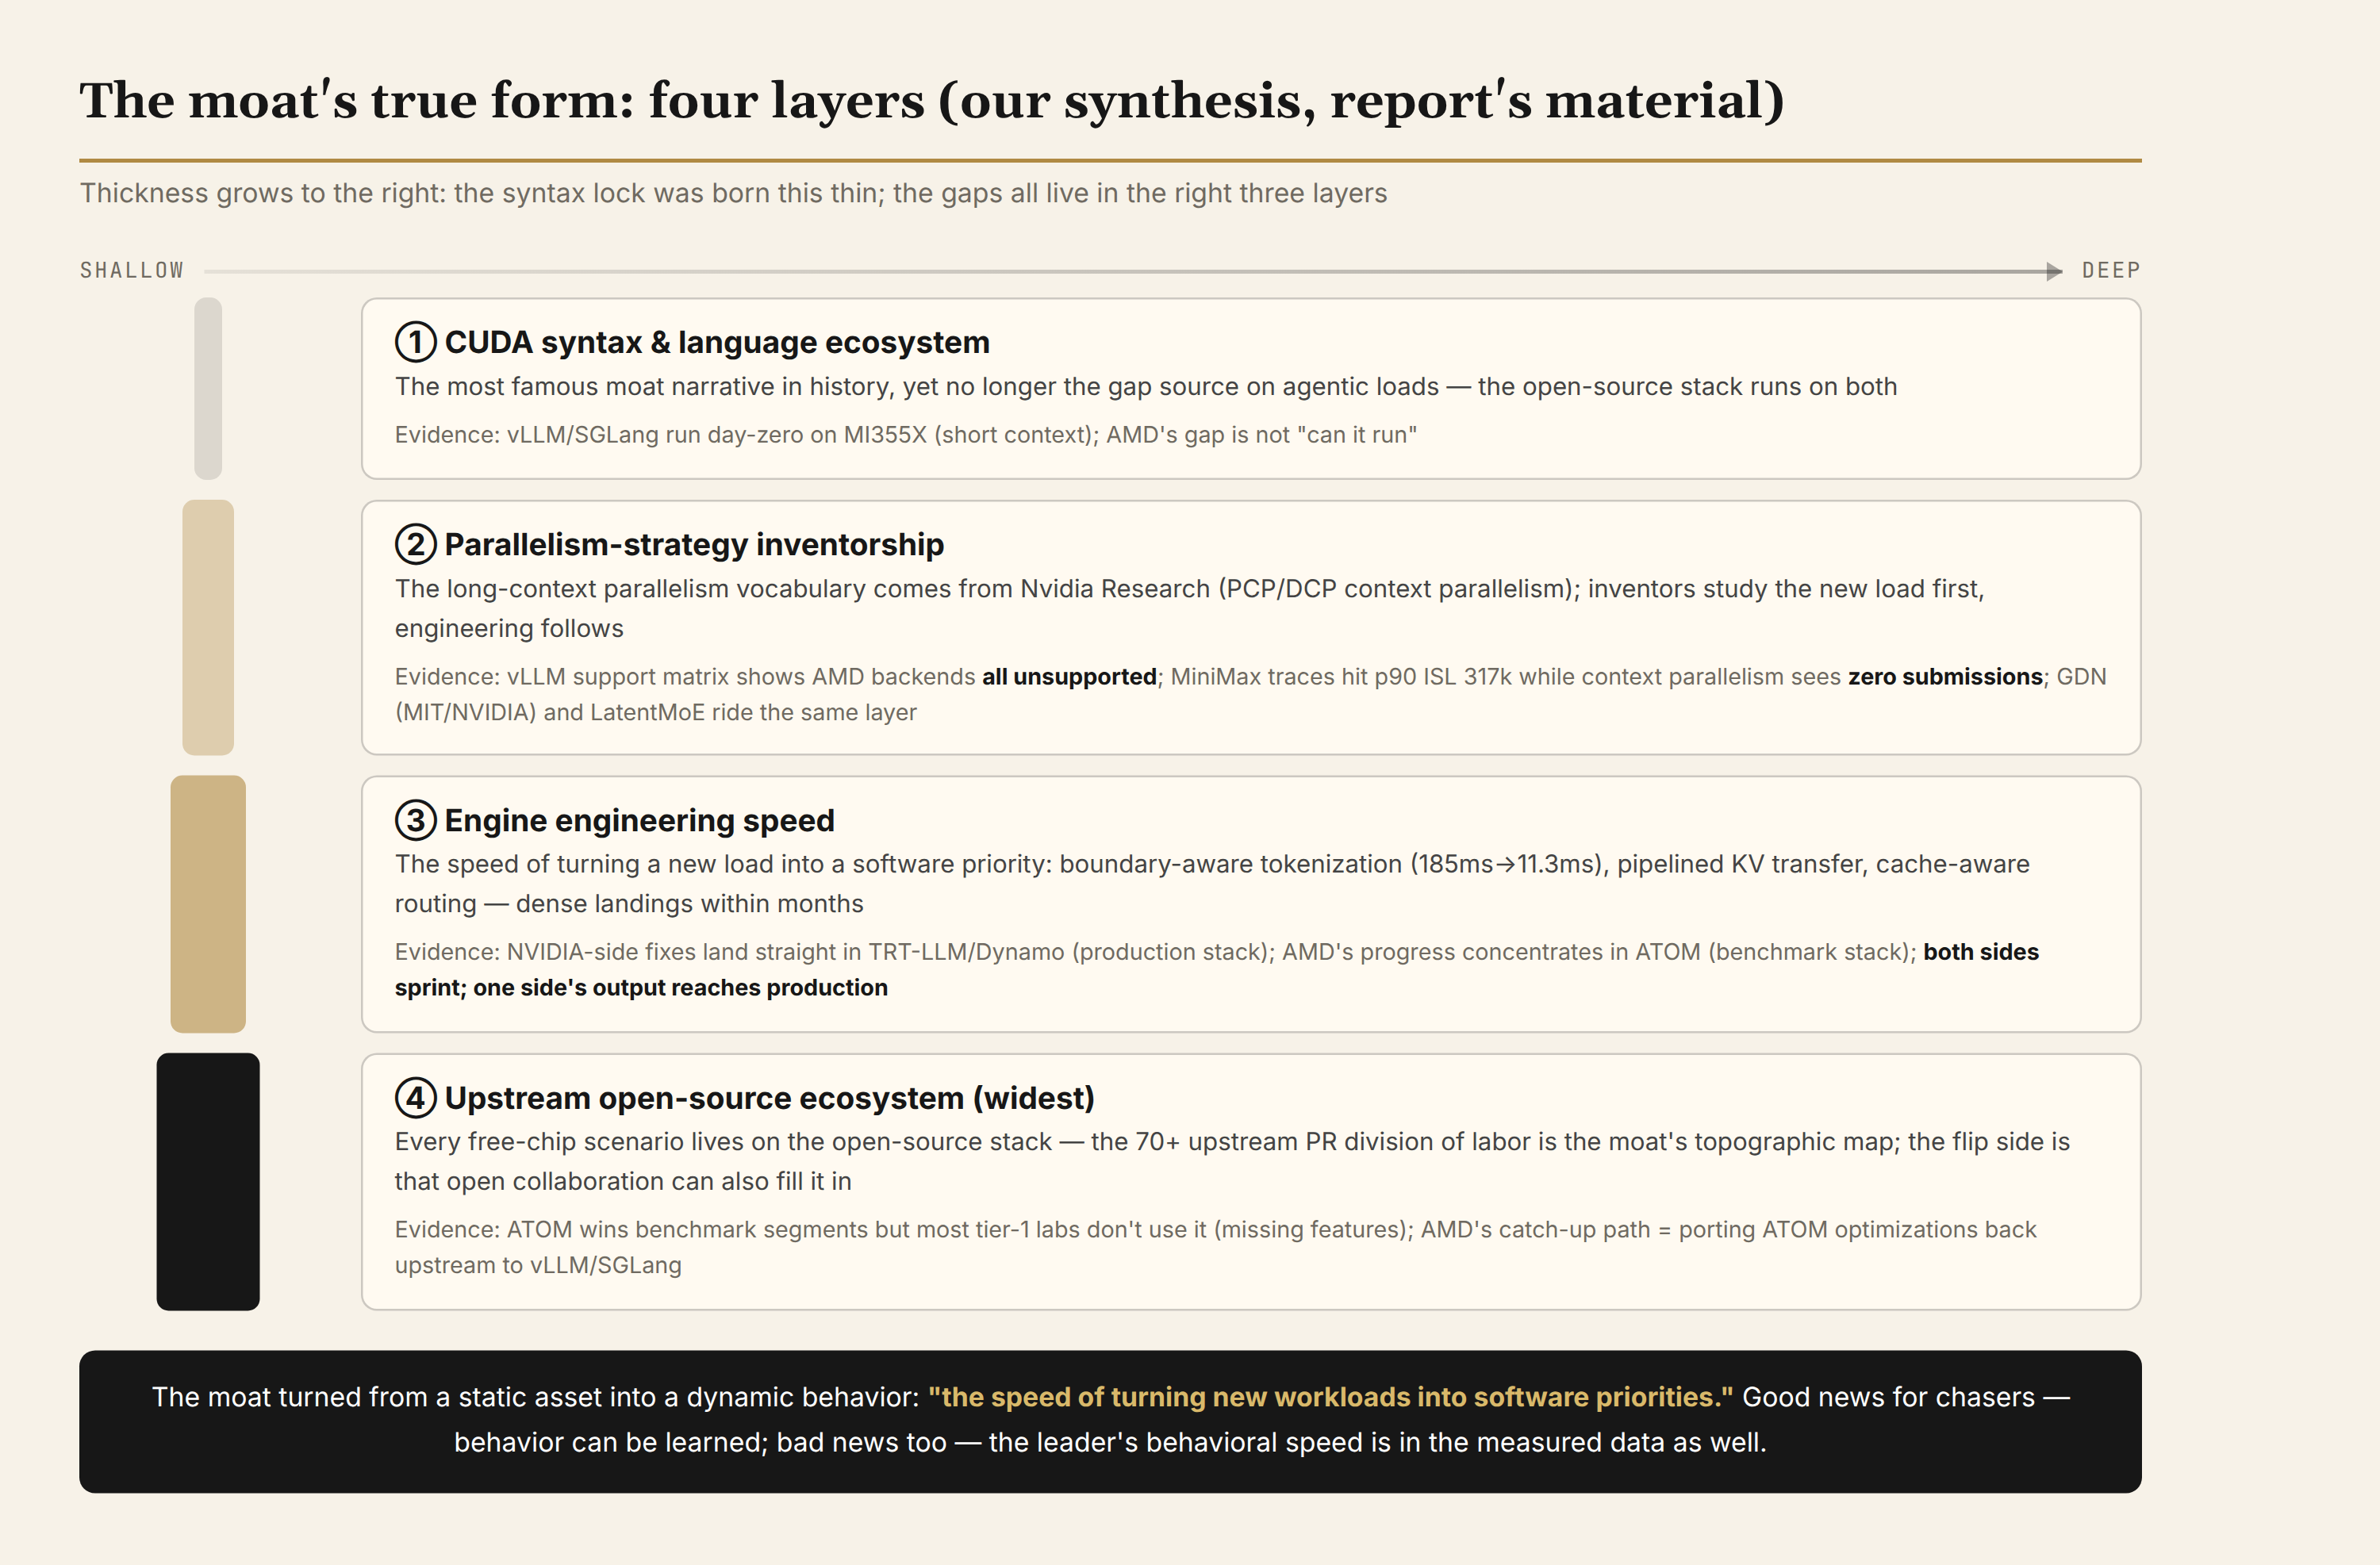
On that foundation, we propose a three-layer structure. The first layer is parallelism-strategy inventorship. Long context turns parallelism from an optional optimization into a necessity, and the vocabulary of this layer — PCP, DCP, plus GDN and LatentMoE as adjacent inventions — comes largely out of Nvidia Research. The inventors study the new workload first and engineering follows; the moat lives between papers and PRs. The second layer is engine engineering speed. Boundary-aware tokenization, pipelined KV transfer, cache-aware routing — these landed densely within months. NVIDIA-side optimizations go straight into TensorRT-LLM and Dynamo; AMD's progress concentrates in its own ATOM. Both sides sprint; one side's output reaches the production stack while the other's is still winning benchmarks. The third layer is upstream-ecosystem inertia. The map of seventy-plus PRs is the moat's topographic map, and every scenario where the free-chip argument holds lives on the open-source stack. The moat is widest on the open-source side. The flip side of that sentence: the moat can also be filled in by open collaboration, and the report has already drawn AMD's catch-up path — port ATOM's optimizations back upstream into vLLM and SGLang.
So our answer: the CUDA moat is real, but the main force holding it up has rotated out, from CUDA syntax and the language ecosystem to "the speed of turning new workloads into software priorities." The syntax lock has existed since CUDA's birth; the gaps AgentX measured grew within the last few months. The moat turned from a static asset into a dynamic behavior. Good news for chasers, because behavior can be learned; bad news too, because the leader's behavioral speed sits in the measured data as well.
One acerbic footnote deserves its own line: the authors praise Nvidia Research's fundamentals (GDN, LatentMoE, context parallelism) while calling NVIDIA's own Nemotron3 Ultra "embarrassing America," beaten by a 27B Qwen3.8. Research and product are two different capabilities, and the moat lives in the former. That is SemiAnalysis's opinion; we quote it because it precisely locates the moat.
Seven: Who Defines the Workload Defines the Market (with Falsification Clauses)
Back to the line from the introduction: the conclusion is left to the community. That posture is itself the power differential between AgentX and vendor benchmarks — data fully open, conclusions unmonopolized. And the other face of that power has already materialized: tier-1 lab capacity teams consume its API, engineers at both chip giants submit optimizations against it as a north star, with four of the five model vendors' names on the supporter list. When a third-party benchmark starts allocating the industry's attention, it defines far more than performance: which models get seats (all five go to Chinese open-weight models), which loads get replayed (real Claude Code traces), which metrics go on the wall (throughput, TTFT, cost per token). Each choice steers hundreds of billions of dollars of capex.
For the open question from our previous piece, there is now an institutionalized sequel: the AgentX workload behind NVIDIA's 30×/35× numbers was run by NVIDIA itself and tagged as pending SemiAnalysis review. The review now has a schedule — the report says Rubin lands on InferenceX within August. Independent review has gone from a footnote to a calendar entry, which matters more than any single result: the vendor citing the benchmark and the benchmark auditing the vendor are becoming two faces of the same coin. The low-latency flank is being absorbed too: InferenceX already carries a dedicated piece pitting TileRT against Cerebras, Groq's LPU, and SambaNova. The six-player landscape we analyzed will soon get a same-benchmark scoreboard.
"Benchmark as power" has one more meaning: it hands China's model industry a seating chart on a world stage. Five frontier open-weight seats, all Chinese, with Kimi K3 serving as the open-weights proxy for Claude-class architectures (comparable parameter scale and architecture family, per the report). Model strength, compute ecosystem, and benchmark authority currently sit in different hands — that misalignment deserves its own analysis.
The judgments in this piece stand in front of these counterexamples. If Rubin's independent InferenceX results come in far below NVIDIA's self-measured 30×/35×, our "self-measurement is progress, pending review is honesty" framing must be rewritten as "systematic framing," and the previous piece's open question along with it. If the update article in a few weeks shows AMD porting ATOM optimizations upstream into SGLang/vLLM, the free-chip argument starts its expiry countdown and the "widest at the open-source side" judgment narrows. If MI455X UALoE72 or TPUs arrive and immediately overturn AgentX rankings, "the moat is software speed" must expand to "software speed × interconnect topology." If any submission starts running context parallelism — currently zero — the inventorship layer begins to erode. The benchmark itself keeps evolving: an update lands within weeks, and Rubin, TPUs, and MI455X are all on the way. Handing judgments to falsifiable schedules is the posture this report just taught the industry.
Further reading: From Solo Bet to Consensus: Groq 3 LPX Full Production and Low-Latency Inference's Eight Months (previous in this series; source of the 30×/35× framing) · SubQ: A Three-Month Audit (the same methodological drill in third-party auditing)