How Agents Go Off Track
When an AI Agent picks the wrong tool at step 7, the remaining 13 steps are pure waste — and traditional monitoring can't see it
Deep Dive 3 / 3 · This article is the third deep dive into The Three Blind Spots of AI Observability, focusing on Agent decision path observability.
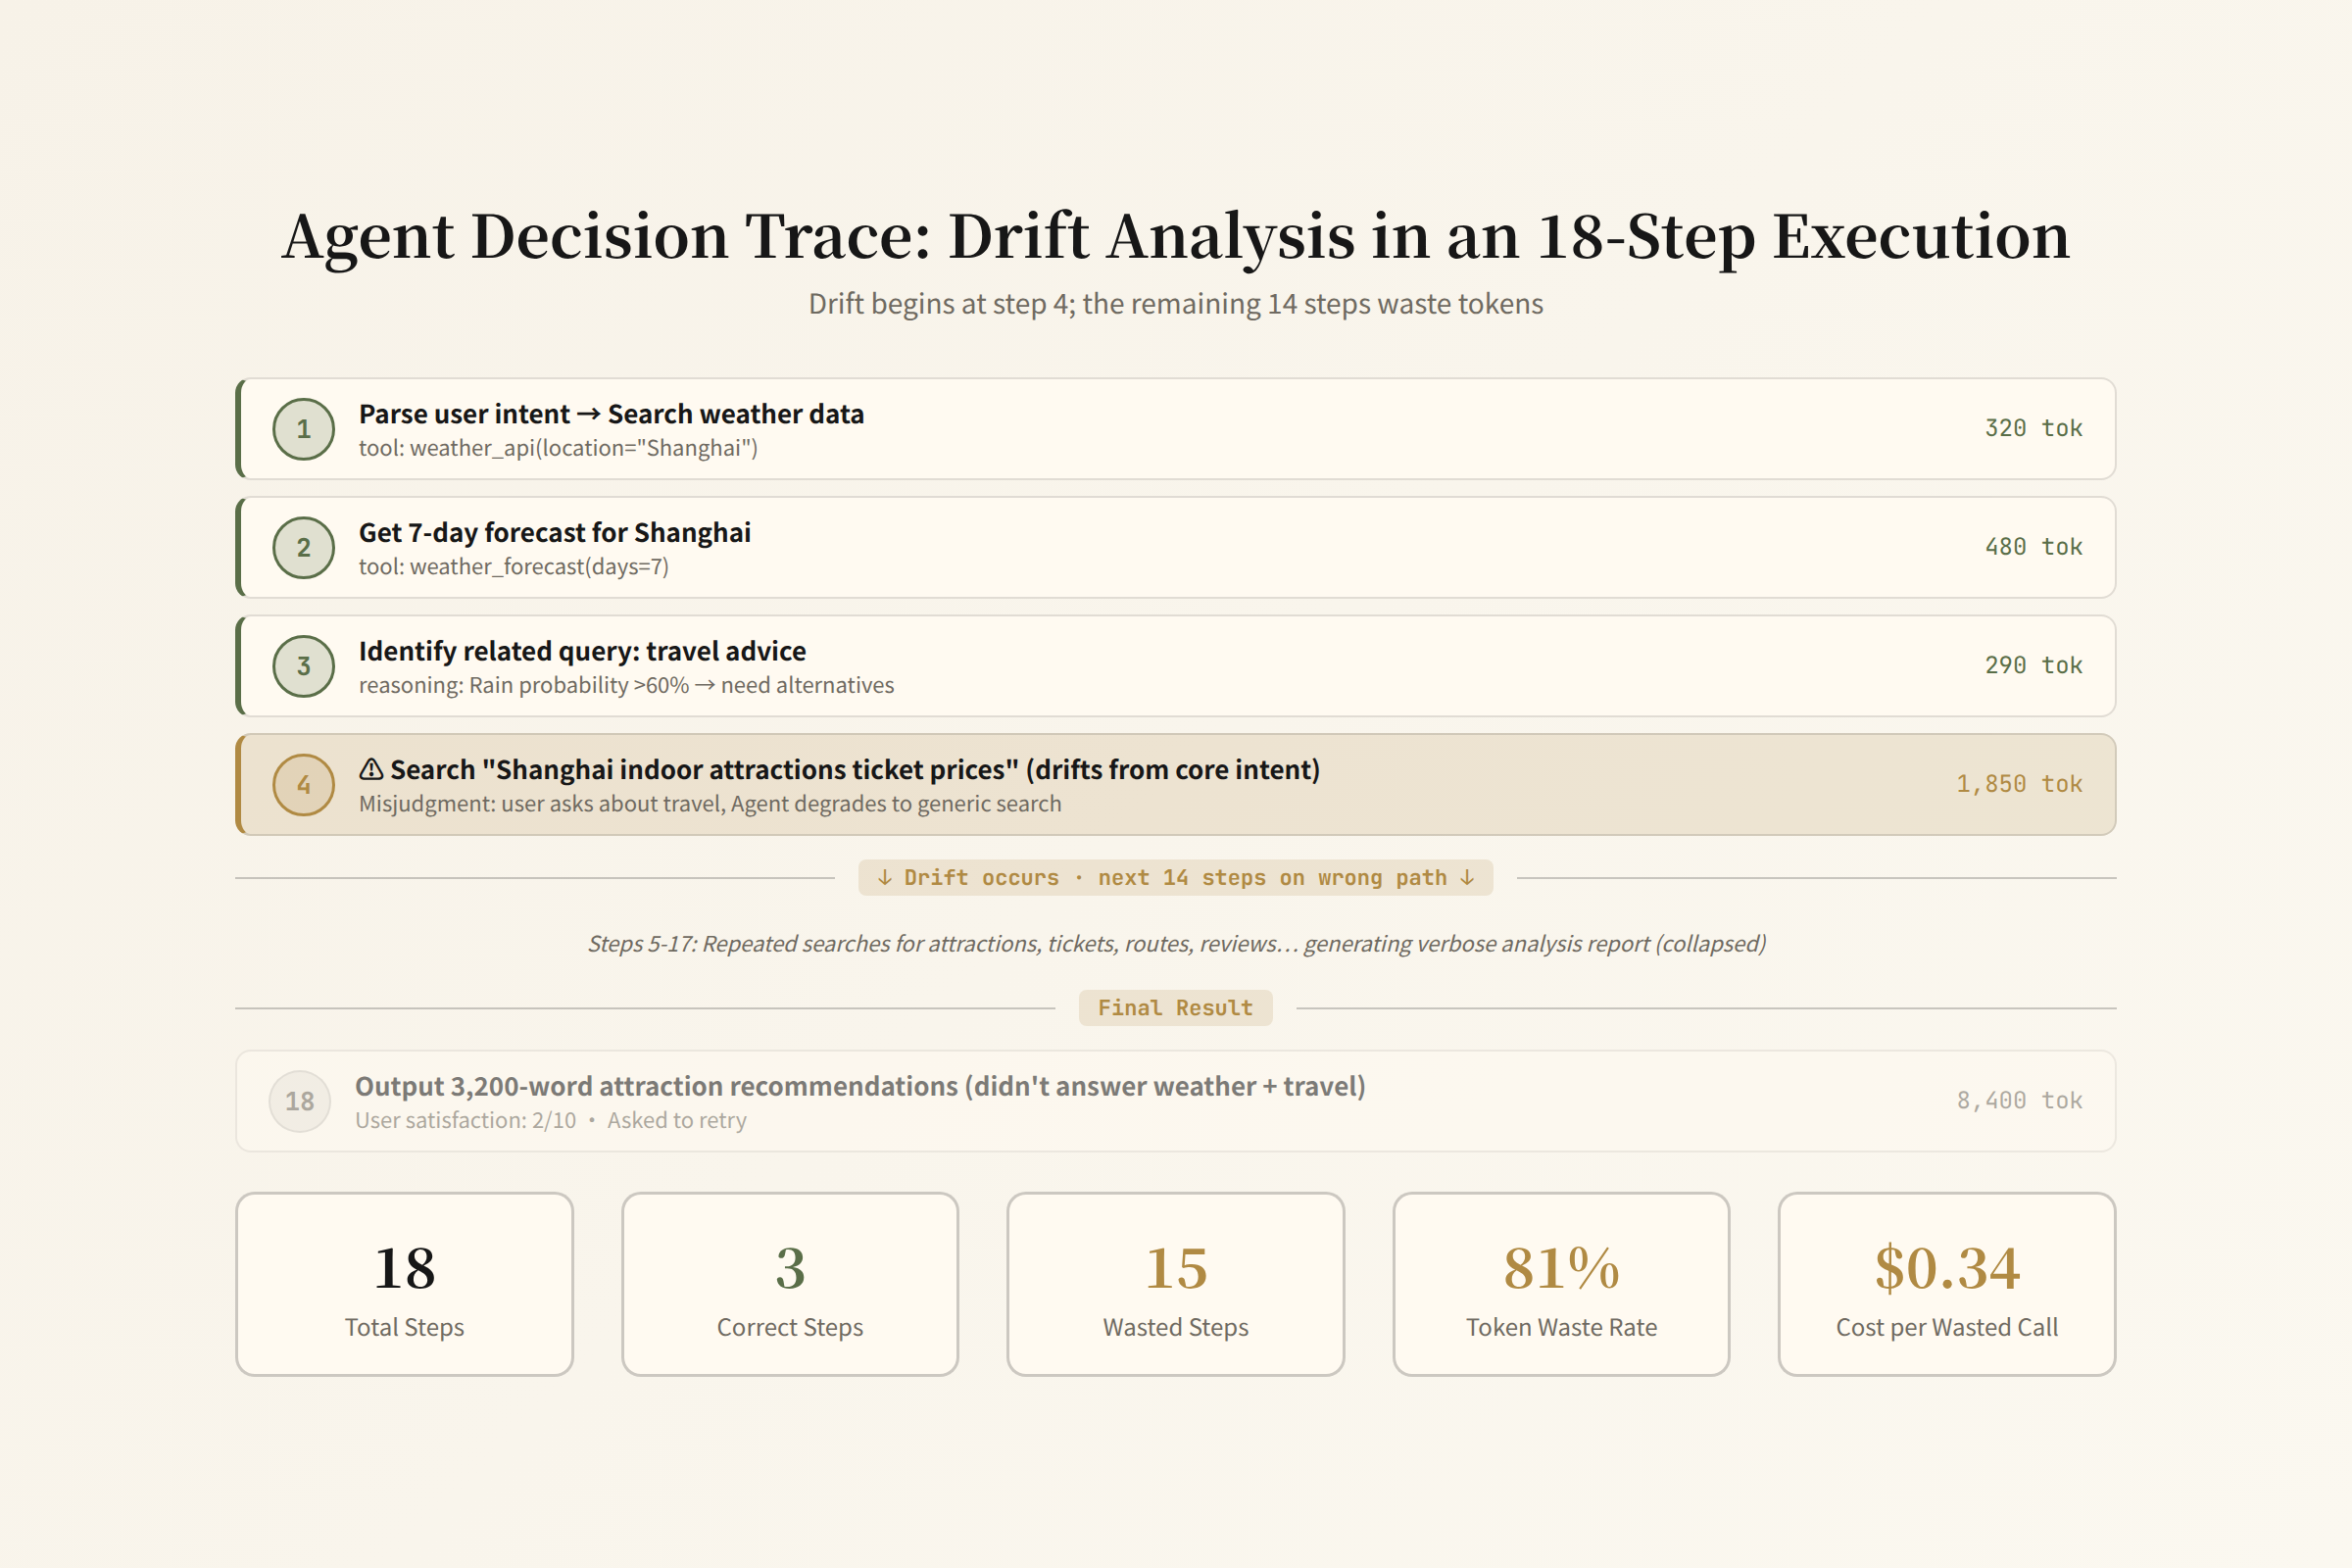
An 18-Step Task by a Data Analysis Agent
Imagine an enterprise data analysis Agent that receives the task: "Analyze the pricing changes of our three main competitors over the past 30 days. Find out who adjusted prices, by how much, and the likely reasons."
The Agent executes. 18 steps later, it outputs a report.
The report looks professional, well-structured, and data-rich. But it's wrong — because at step 4, the Agent confused the product lines of "Company A" and "Company B." The remaining 14 steps were all analyzing the wrong comparison.
Let's break down these 18 steps with an idealized Agent trace to see what happened at each step, why traditional monitoring can't see the problem, and what kind of observability could catch it.
Trace Overview
Run #agent-20260620-001
Goal: Analyze competitor pricing changes
Duration: 4m 32s
Steps: 18
Tokens: input 187,000 / output 12,400
Cost: $1.72 (estimated at Claude Opus pricing, including prompt caching: 80% input cached at 10% billing)
Status: ✅ Completed (but the result is wrong)
Traditional monitoring sees: Status = Completed, Duration = 272s, Cost = $1.72. All good.
Step-by-Step Breakdown
Step 1  [Thought]  Understand task: analyze 30-day pricing changes for 3 competitors
        Tool: web_search("Company A pricing 2026")
        Result: Returns 10 search results
        ✅ Correct

Step 2  [Thought]  Start with Company A
        Tool: web_search("Company A product line pricing page")
        Result: Returns Company A official pricing page link
        ✅ Correct

Step 3  [Thought]  Get Company A pricing details
        Tool: web_fetch("https://company-a.com/pricing")
        Result: Returns pricing page HTML, contains 3 product lines
        ✅ Correct

Step 4  [Thought]  Company A's Enterprise product line went from $49/user/mo to $59
        ❌ Semantic drift: Confused Company A's Team product line ($49) with
           Company B's Pro product line ($49).
           Reason: In Step 3's pricing page, Company A's product lines are
           named "Team," "Business," "Enterprise" — but the Agent
           incorrectly associated the "Pro $49" seen in a Company B ad
           from Step 2's search results.
        Tool: execute_sql("INSERT INTO pricing_data VALUES...")
        Result: Wrote incorrect data
        ⚠️ No error — write succeeded
From Step 4 onward, every analysis the Agent does is built on a wrong premise.
Step 5  [Thought]  Company A raised prices 20.4%, record this finding
        Tool: web_search("Company A price increase news")
        Result: No relevant news found
        ❌ Agent interpreted no news as "stealth price increase"

Step 6  [Thought]  Search for Company B pricing
        Tool: web_search("Company B pricing")
        Result: Returns Company B pricing page

Step 7  [Thought]  Get Company B pricing details
        Tool: web_fetch("https://company-b.com/pricing")
        Result: Returns pricing page

Step 8  [Thought]  Company B's Pro product line holds steady at $39
        ✅ The analysis of Company B itself is correct
        But due to Step 4's confusion, all subsequent comparisons
        are built on a wrong baseline

Step 9  [Thought]  Compare Company A and Company B
        Tool: execute_sql("SELECT ... FROM pricing_data")
        Result: Returns incorrect data (from Step 4)
        ❌ Comparison results are completely wrong

Step 10 [Thought]  Company A raised 20% vs Company B unchanged,
                   Company A is raising prices to capture margin
        ❌ Wrong conclusion based on wrong data

Step 11-15 [Thought]  Continue analyzing Company C, generate charts,
                      write analysis report
        All based on Step 4's incorrect data

Step 16 [Thought]  Check data quality
        Tool: execute_sql("SELECT COUNT(*) FROM pricing_data")
        Result: 3 records
        Agent judges: data complete ✅
        ❌ Checked completeness, not correctness

Step 17 [Thought]  Generate final report
        Tool: generate_report(...)
        Result: A perfectly formatted report with wrong content

Step 18 [Thought]  Task complete
        Output: "Analysis complete. Company A Enterprise went from $49 to $59..."
Waste Quantification
Total token consumption: 199,400
Effective tokens (Step 1-3 correct exploration): 38,000 (19%)
Wasted tokens (Step 4-18 wrong path): 161,400 (81%)
Total cost: $1.72
Wasted cost: $1.39 (81%)
Of the $1.72 this task cost, $1.39 was burned in the wrong direction. Traditional monitoring can't see this waste at all — every API call returned 200 OK.
The Data Model for Agent Traces
The 18-step breakdown above reveals a fundamental problem: Agent execution is not a linear request chain — it's a decision tree where every step has multiple possible branches, and the Agent's "choices" determine the path.
Traditional Trace vs. Agent Trace
Traditional distributed trace:
HTTP Request → Service A → Service B → DB Query → Service C → HTTP Response
This is a linear chain. Each span has start_time, duration, service_name. OpenTelemetry's data model expresses this perfectly.
Agent trace:
Goal → Thought ("I should search Company A first")
     → Tool Call (web_search) → Result
     → Thought ("Looks like Company A has 3 product lines")
     → Tool Call (web_fetch) → Result
     → Thought ("Enterprise went from $49 to $59")     ← Wrong inference
     → Tool Call (SQL INSERT) → Result                  ← Wrong data written
     → Thought ("Company A raised 20%")                 ← Based on wrong premise
     → Thought ("No news coverage, possibly stealthy")  ← Wrong attribution
     → ...
This isn't a linear chain — it's a tree with branches. Each node has:
- Thought: The LLM's reasoning process (free text)
- Tool Call: Tool name, parameters, return value
- Decision: Why this path was chosen over alternatives
- Assumption: What assumptions the Agent made at this step
- Error: Explicit errors (exceptions, timeouts)
- Semantic Drift: Implicit drift (no error but direction is off)
Traditional OTel spans can't express Thought and Decision — they're semantic information, not structured fields. This is why a dedicated Agent trace data model is needed.
OpenInference Extensions
OpenInference (led by Arize) extends OpenTelemetry's semantic conventions with AI-specific fields:
# Traditional OTel span
span.set_attribute("http.method", "POST")
span.set_attribute("http.url", "/api/chat")
span.set_attribute("http.status_code", 200)

# OpenInference span
span.set_attribute("llm.model", "glm-5.2")
span.set_attribute("llm.token_count.prompt", 45000)
span.set_attribute("llm.token_count.completion", 3200)
span.set_attribute("llm.cost", 0.064)
span.set_attribute("llm.tools_called", ["web_search", "execute_sql"])
span.set_attribute("llm.decision_path", "search → fetch → analyze")
span.set_attribute("llm.retrieval.context", "...")
These fields let traces show not just "what was called" but also "what was consumed" and "what was chosen."
agent-run: A Purpose-Built Agent Standard
agent-run (builderz-labs) goes further, defining atomic units for Agent observation:
Run
  id: string
  goal: string
  status: running | completed | failed | abandoned
  started_at: timestamp
  finished_at: timestamp
  total_cost: float
  total_tokens: int
  Step[]
    id: string
    type: thought | tool_call | error | handoff
    content: string
    result: string
    duration_ms: int
    cost: float
    parent_step_id: string
This structure is better suited for Agent scenarios than OTel spans — it natively supports decision trees, thought text, tool call parameters, and return values. But it's not yet supported by mainstream OTel backends (Jaeger, Tempo, Datadog) and is currently used primarily in dedicated Agent observation tools (Atla, Langfuse's Agent mode).
Detecting Semantic Drift
The hardest observability problem for Agents isn't detecting errors — errors have exceptions, error codes, and traditional methods catch them. The hardest part is detecting semantic drift: the Agent hasn't errored, but its direction is wrong.
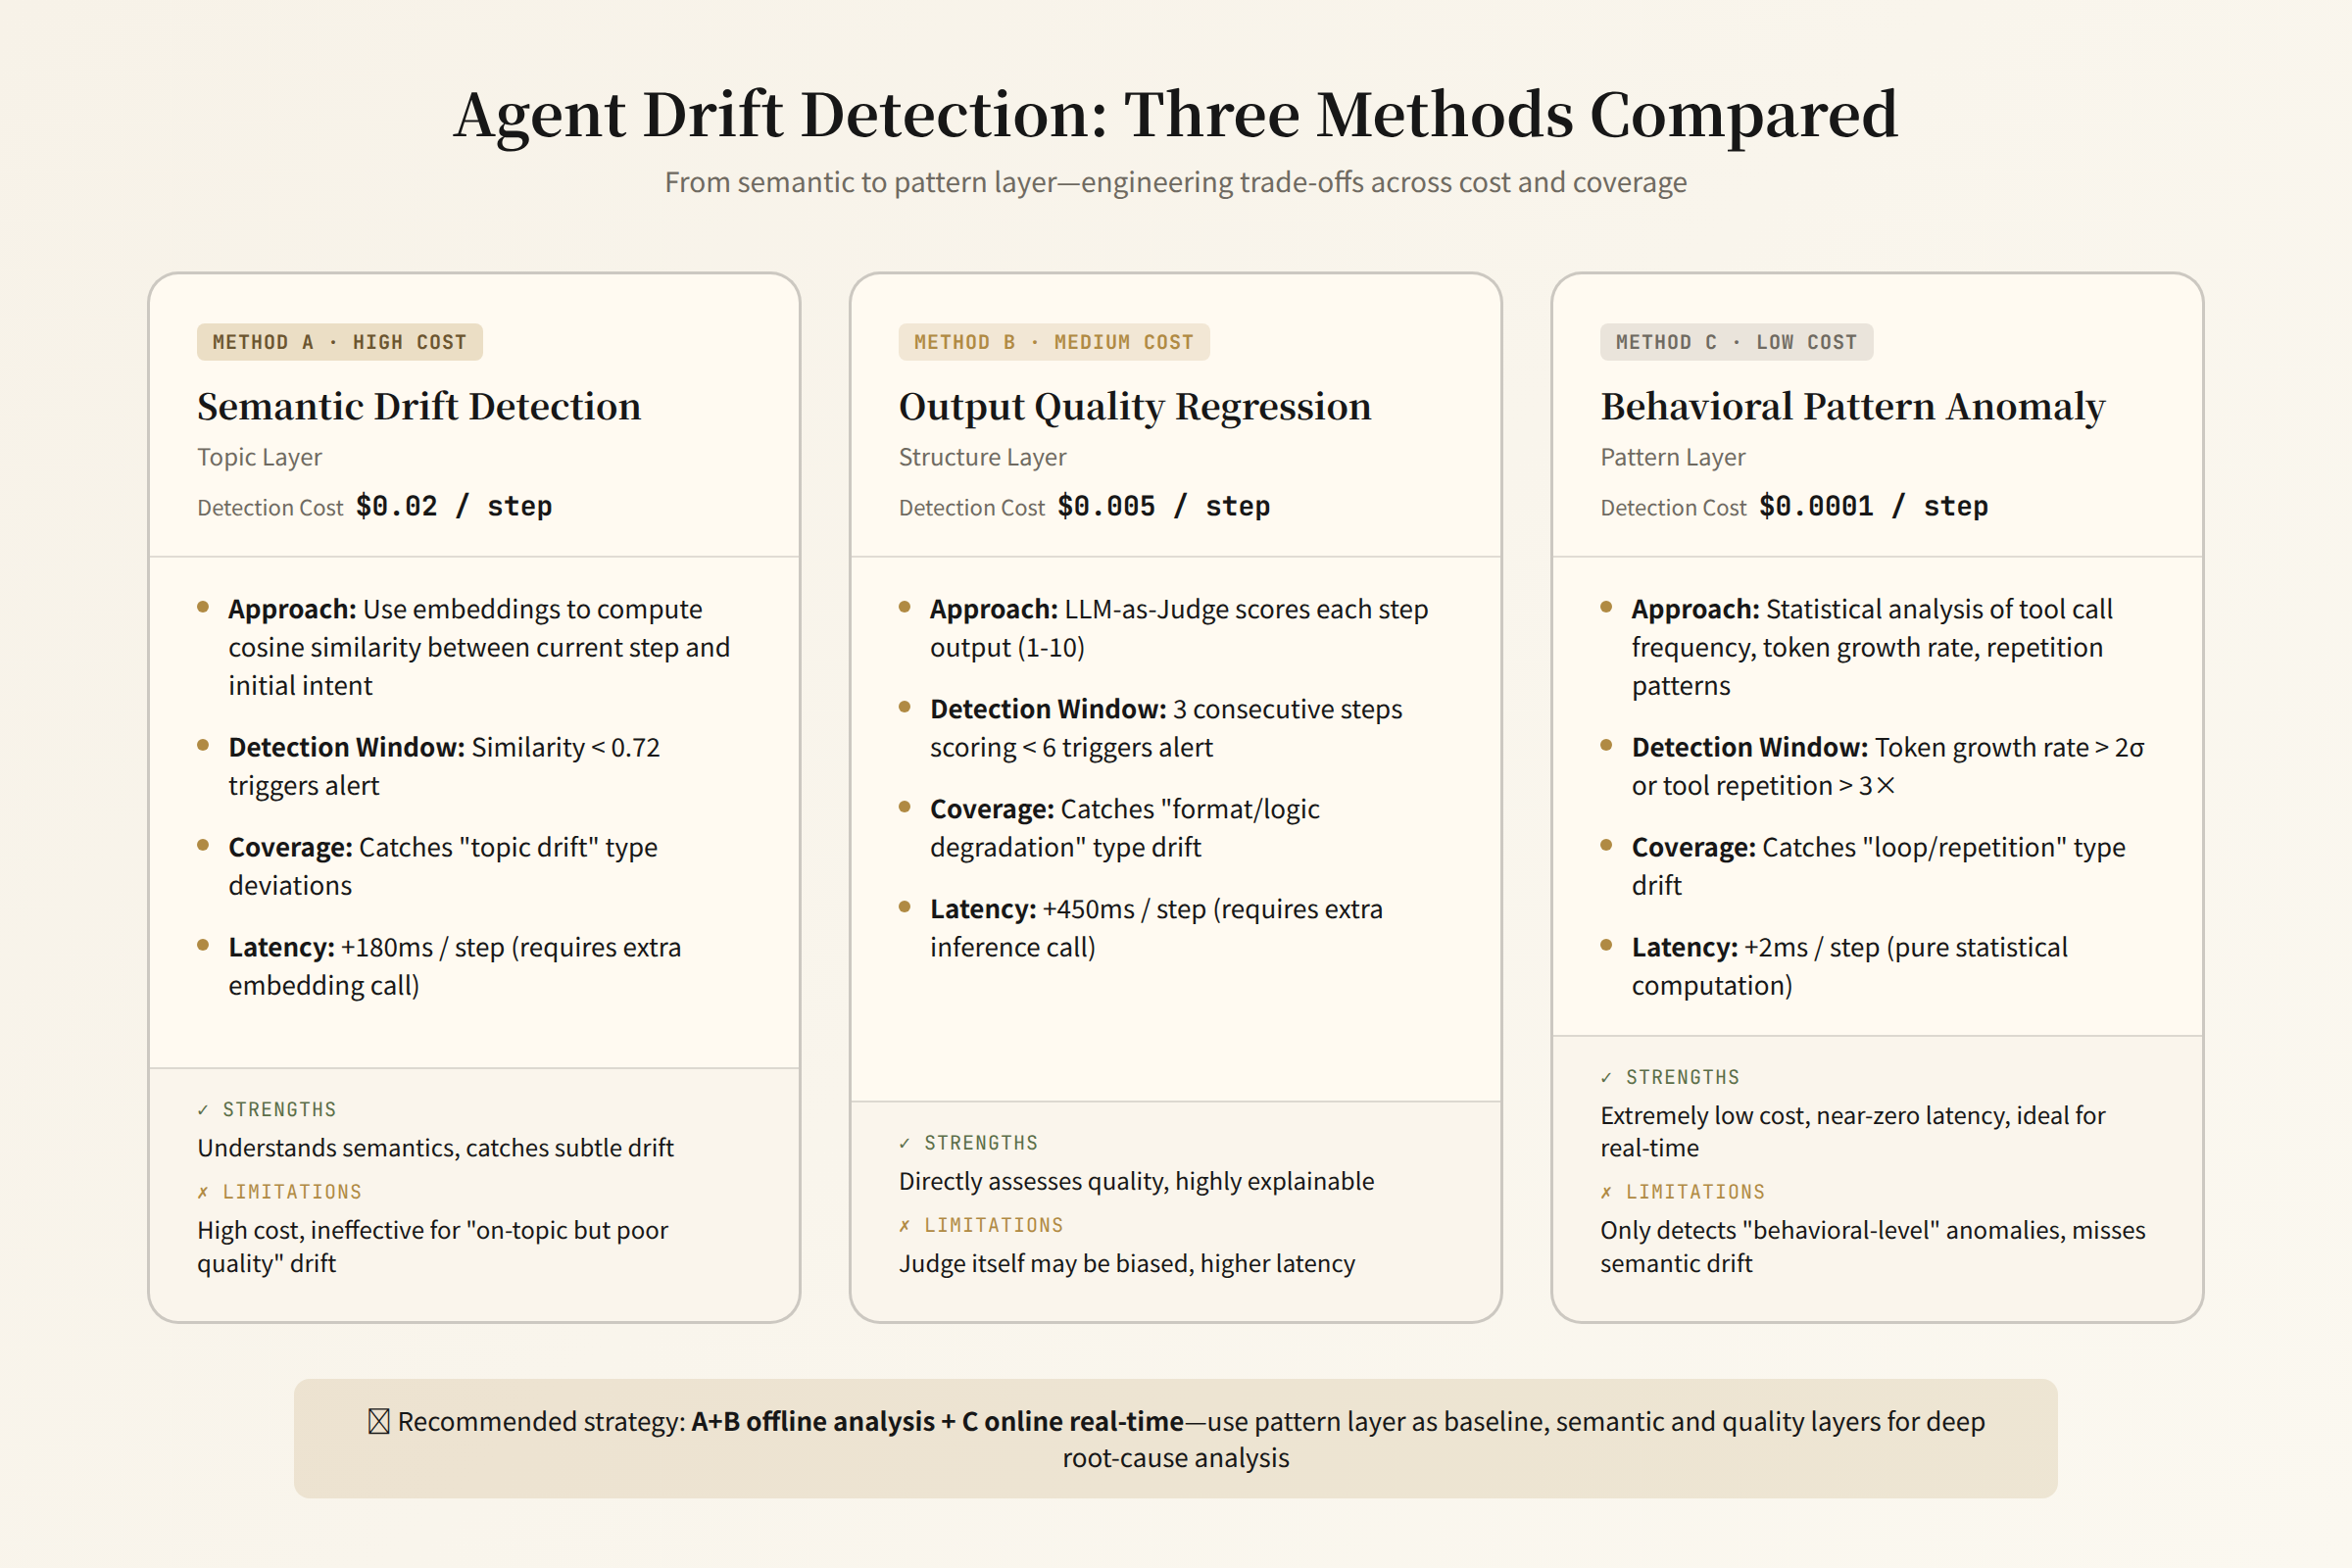
Three Detection Methods
UC Berkeley's MASFT research (2025) systematically classified failure modes in multi-Agent systems: 14 failure modes across 3 categories (specification/system design failures, inter-agent misalignment, task validation and termination). In AppWorld tests, multi-Agent systems had a failure rate of 86.7% [4].
Method 1: Semantic Drift Detection
After each Agent thought step, use a lightweight evaluation model to judge "is the current thinking drifting from the original goal":
Evaluator input:
  Goal: "Analyze pricing changes for 3 competitors"
  Current Step (Step 4): "Company A's Enterprise product line went from $49 to $59"

Evaluator output:
  relevance_score: 0.85 (still relevant)
  confidence: 0.9

→ Step 4 is not flagged as drift
The problem: semantic drift detection is itself an LLM call with cost and latency. Doing it every step could double the cost. And for steps like Step 4 that are "wrong but appear relevant," the evaluator also struggles — because the Agent's description is coherent, just factually incorrect.
Method 2: Output Quality Regression
Set checkpoints at critical steps — after the Agent finishes data collection and before analysis, run a validator to check data quality:
Checkpoint (after Step 9):
  Validator checks: Is the data in pricing_data table reasonable?
    - Company A Enterprise $59 ← within reasonable range
    - Company B Pro $39 ← within reasonable range
    - Company C ... ← within reasonable range

  Validator cannot detect: Company A's Team product line mislabeled as Enterprise
  → Checkpoint passes, no interception
Data-level checkpoints can catch structural anomalies (null values, format errors, range violations), but not semantic errors — the data looks perfectly normal, just associated with the wrong entity.
Method 3: Behavioral Pattern Anomaly
Instead of checking single-step correctness, detect whether the overall execution sequence pattern is abnormal:
Normal Agent execution pattern:
  search → fetch → extract → store → search → fetch → ...
  Tool call types alternate at each step

Abnormal pattern examples:
  1. Loop: search → fetch → search → fetch (same query)
     → May be stuck in an information retrieval loop

  2. Overlong chain: thought → thought → thought → thought → ... (no tool call)
     → May be in reasoning hallucination without real validation

  3. Skip: search → skip_validation → skip_analysis → generate_report
     → Skipped critical steps and jumped to conclusions
Behavioral pattern detection doesn't need to understand the Agent's semantics — it only analyzes statistical features of the tool call sequence. This approach is cheap (no extra LLM calls) but limited in precision — it can only detect structural anomalies, not whether each step is in the right direction.
Current State: No Silver Bullet
All three methods have limitations:
| Method | What It Detects | What It Misses | Cost |
|---|---|---|---|
| Semantic drift detection | Topic-level drift | Factual errors | High (one LLM call per step) |
| Output quality regression | Structured data anomalies | Semantic correctness | Medium (checkpoint validation) |
| Behavioral pattern anomaly | Execution pattern deviations | Single-step correctness | Low (pure statistics) |
The practical best practice is combining all three: behavioral pattern detection for coarse filtering (low cost), output quality regression for key checkpoint validation, and semantic drift detection for full-chain auditing of high-value tasks.
Loop Deadlock
The Phenomenon
An Agent gets stuck in a "search → read → search the same thing → read again" loop. Every step executes successfully (200 OK), but the entire chain is spinning in place.
Recent industry exploration (such as AgentDoG-style security diagnostic tools) analyzes complete Agent trajectories from three dimensions: Risk Source, Failure Mode, and Real-world Harm — looking beyond final output to the entire execution path. AgentConductor (SJTU i-WiN + Meituan, 2026) made an equally compelling finding: a 3B-parameter conductor Agent trained with RL dynamically generates interaction topologies, achieving 14.6% accuracy improvement on competition-level programming tasks while reducing token cost by 68% [5] — indirectly proving that fixed-topology multi-Agent communication contains significant redundant information transfer.
A simplified version of a real pattern:
Step 1: search("Company A pricing")
Step 2: fetch(company-a.com/pricing)
Step 3: search("Company A price change 2026")
Step 4: fetch(company-a.com/pricing)        ← repeat
Step 5: search("Company A pricing plans")   ← nearly identical to Step 1
Step 6: fetch(company-a.com/pricing)        ← repeat again
Step 7: search("why Company A pricing")     ← another near-duplicate
Step 8: fetch(company-a.com/pricing)        ← third repeat
Traditional APM: Every API returns 200. Every page fetched successfully. No anomalies.
Agent trace: Search queries and fetch URLs are highly clustered in semantic space. Information gain between steps approaches zero.
Detection Methods
Query embedding similarity: Convert each step's search query into an embedding. Compute cosine similarity against all previous queries. If 3 consecutive steps have query similarity >0.85, flag as a loop.
Tool return information gain: Compare the overlap between current and historical tool returns. If fetching the same URL returns identical content (the page hasn't changed), information gain = 0.
Context growth rate analysis: During normal Agent execution, context length should grow steadily (new information added each step). If context growth rate suddenly approaches zero — net new information per step <100 tokens — the Agent is treading water.
Automated Intervention
Once a loop is detected, automated intervention is possible:
- Prompt injection: Add to the Agent's next-step input:
"You appear to be searching for the same information repeatedly. Try different keywords or a different approach." - Forced redirection: Prevent the Agent from using the same or semantically similar queries again
- Human escalation: If the loop persists beyond 5 steps, pause the Agent and notify a human
Context Bloat and Reasoning Quality Degradation
The Problem
Every Agent step adds tool returns to the context. By step 15, the context might be 200K tokens — mostly historical tool returns (search results, SQL output, API responses).
But the model's effective attention isn't uniformly distributed. The "Lost in the Middle" phenomenon (Liu et al., 2023, arXiv:2307.03172) delivered a disturbing finding: GPT-3.5-Turbo's accuracy when key documents are in the middle position is about 54%, lower than the closed-book accuracy without any context at 56.1% [6]. Chroma's Context Rot report (2025.07, testing 18 models) further found that accuracy begins degrading beyond 32,000 tokens [7].
- Start (system prompt, early steps): High attention
- Middle (tool returns from historical steps): Low attention — the "blind spot"
- End (latest step input): High attention
Quantifying the Impact
Research shows that as context grows from 4K to 128K:
- Information retrieval accuracy at the start and end degrades by <5%
- Information retrieval accuracy in the middle position degrades by 20–40%
Impact on Agents: The key information obtained at Step 3 (Company A's product lines are named "Team," "Business," "Enterprise"), by the time the comparison happens at Step 10, has sunk to the middle of the context — the model's attention to it has diminished. Worse, Liu et al. (2023) found that GPT-3.5-Turbo's accuracy with key documents in the middle (54%) is actually lower than closed-book accuracy with no context at all (56.1%). Providing context can be actively harmful — this is a fundamental challenge for Agent architecture. This is exactly the cognitive basis for Step 4's product line confusion.
Context Management
Three strategies for addressing context bloat:
Strategy 1: Sliding Window
- Keep only the last N steps of full records
- Earlier steps are replaced by summaries
- Drawback: The summarization process may lose critical details
Strategy 2: Selective Retention
- Assign an "importance score" to each step
- Low-importance steps are discarded
- Drawback: Determining importance is itself a hard problem
Strategy 3: External Memory
- Store tool returns in external storage (vector database)
- Retrieve relevant information from external storage at each step
- Context retains only system prompt + retrieval results + most recent 2–3 steps
- Drawback: Retrieval quality depends on embedding and indexing
Information Loss in Multi-Agent Handoffs
The Scenario
In a multi-Agent system:
Agent A (data collection) → Agent B (data analysis) → Agent C (report generation)
Agent A spends 10 steps collecting data. Along the way it:
- Considered but discarded 2 data sources (insufficient quality)
- Made internal reliability judgments (Company B's data may be outdated)
- Noticed an anomaly but decided to defer (Company C's price suddenly doubled — possibly a scraping error)
Agent A finishes and hands the "result" to Agent B. But what is the "result"?
Typically, what Agent A passes to Agent B is a structured dataset or a summary paragraph. The alternative approaches A considered, the data quality judgments, the observed anomalies — all lost. Agent B makes the next analytical step with a heavily compressed version of A's understanding.
Quantifying Information Loss
Agent A's complete cognitive state:
  - Factual data: ~5,000 tokens
  - Exploration process: ~15,000 tokens
  - Data quality judgments: ~2,000 tokens
  - Anomaly observations: ~1,000 tokens
  - Discarded alternatives: ~3,000 tokens
  Total: ~26,000 tokens

What Agent A passes to Agent B:
  - Structured dataset: ~5,000 tokens
  - A summary paragraph: ~500 tokens
  Total: ~5,500 tokens

Information retention rate: 5,500 / 26,000 ≈ 21%
Agent B receives only 21% of Agent A's cognitive state. The lost 79% — quality judgments, anomaly observations, discarded paths — may prove critical later.
Solution Directions
Rich Handoff: Pass not just the result but the full reasoning trace. Agent B can access all of Agent A's thoughts and tool call history. But this causes Agent B's context to balloon, triggering context bloat.
Structured Metadata Transfer: Along with results, Agent A attaches structured metadata — data quality scores, known anomaly lists, brief descriptions of discarded paths. This is more compact than a full trace but requires Agent A to proactively generate this metadata.
Shared Memory Layer: Agent A and Agent B share an external memory store. Agent B retrieves Agent A's reasoning details on demand. This avoids context bloat but introduces retrieval latency and accuracy issues.
Security Observability: The Audit Imperative for Agents
Agents aren't read-only systems — they call APIs, spend money, modify files, and send messages. Every action needs auditing.
Deconvolute: The MCP Firewall
Deconvolute is a client-side runtime firewall that wraps around MCP (Model Context Protocol) tool calls:
Agent decides to call execute_sql("DELETE FROM users WHERE...")
  ↓
Deconvolute intercepts:
  1. Check if execute_sql is in the allowed tools list ✅
  2. Check if parameters match baseline definition ✅
  3. Check if SQL type is permitted by policy:
     - SELECT ✅
     - INSERT ⚠️ Requires confirmation
     - DELETE ❌ Blocked by policy
     - DROP ❌ Blocked by policy
  4. Block, write audit log, return error to Agent
Every tool call is:
- Cryptographically signed and verified: Ensuring tool definitions haven't been tampered with
- Policy-matched: Compared against a predefined policy baseline
- Audit-logged: Call parameters, return values, and decisions (allow/deny) are written to an immutable log
This isn't observation — it's interception. But from an observability perspective, Deconvolute's audit log is the most reliable record of Agent behavior: because it's captured at the tool call layer, it's unaffected by the Agent's self-reporting. An Agent might say in its thought "I'm checking data quality," but if its tool call is DELETE FROM pricing_data, the audit log faithfully records the truth.
The Tooling Landscape
| Tool | Positioning | Strengths | Limitations |
|---|---|---|---|
| Langfuse | Open-source LLM engineering platform | Trace + Prompt management + Evaluation, ClickHouse backend, framework-agnostic | Agent-level thought/decision tracking requires manual instrumentation |
| Arize Phoenix | ML-engineer-oriented | Native OpenInference support, strong embedding analysis | Skews ML rather than Agent |
| Atla | Agent-specific | Real-time thought/tool call visualization, drift detection | New product, small ecosystem |
| agent-run | Agent trace open standard | Defines atomic units for Agent observation | Standard stage, no mature implementations |
| Deconvolute | MCP security firewall | Tool-call-level interception and auditing | Only covers MCP tools |
| Pydantic AI + Logfire | Python Agent + observability | Type-safe Agent definition + native tracing | Tied to Pydantic AI framework |
| LangSmith (LangChain) | LangChain ecosystem | Deep integration with LangChain/LangGraph | Locked into LangChain ecosystem |
| Salesforce Query-Driven Observability | Enterprise-grade Agent observability | Spark-based, validated on 600 users / 400M records | Internal system, not publicly available |
Salesforce's Playbook: From Two Weeks to One Day
Salesforce's Agentforce platform faced the ultimate Agent observability challenge: 60+ AI features, 600 users, 400+ million records, 800GB of data. When an Agent went wrong, engineers needed two weeks to locate the problem.
Their solution: Query-Driven Observability — not predefined dashboards, but letting engineers directly query production Agent behavior data using SQL:
-- Find all Agent runs where token consumption spiked after Step 5
SELECT run_id, step_num, token_count, tool_called
FROM agent_traces
WHERE step_num > 5
  AND token_count > avg_token_count * 3
ORDER BY token_count DESC;

-- Find loop deadlock patterns
SELECT run_id, tool_called, COUNT(*) as call_count
FROM agent_traces
GROUP BY run_id, tool_called
HAVING call_count > 5
ORDER BY call_count DESC;

-- Find cases where quality dropped after handoff
SELECT a.run_id, a.agent_name, b.agent_name,
       a.quality_score, b.quality_score
FROM agent_results a
JOIN agent_results b ON a.run_id = b.run_id
WHERE a.step_type = 'handoff'
  AND b.quality_score < a.quality_score * 0.7;
Core architecture: Spark-based query engine + Notebook environment + 400M records of Agent trace data. Engineers can interactively explore Agent behavior patterns in a Notebook.
Result: debugging time dropped from two weeks to one day. The key isn't the tool's sophistication — it's giving engineers the ability to directly query Agent behavior data, moving from "looking at predefined dashboards" to "asking free-form questions."
Agent Runtime Observability: From Fleet to Individual
The preceding sections broke down Agent decision paths, drift detection, loop deadlocks, context bloat, and handoff information loss individually. But to connect these observation points into a coherent picture, you need a layered system — otherwise 14 failure modes scatter across different tools with no unified dashboard.
Below is an observation system organized into three layers: Global (Agent fleet), Coordination (multi-Agent interaction), and Individual (single-Agent execution). Each layer lists key observation points, metrics, recommended tools, and instrumentation locations.
Global Layer: Agent Fleet Management & Resource Scheduling
| Observation Point | Metric | Tool | Instrumentation |
|---|---|---|---|
| Agent instance health | active / queued / failed_agents | Prometheus | Scheduler |
| Resource consumption | CPU / mem / GPU utilization | cAdvisor | Container runtime |
| Task allocation fairness | per_agent_task_count | Custom analysis | Dispatcher logs |
| Global token burn rate | tokens/sec, burn_rate vs budget | Langfuse | API client aggregation |
| Fault propagation | cascade_depth, blast_radius | OTel trace | Inter-Agent call chain |
The global layer answers: Is the overall Agent fleet healthy? Are any Agents spinning idle? Is the token budget being consumed as expected? Is one Agent's failure propagating to others?
Coordination Layer: Multi-Agent Interaction Observation
| Observation Point | Metric | Tool | Instrumentation |
|---|---|---|---|
| Handoff quality | information_retention_ratio | Custom logger | Handoff point |
| Communication efficiency | messages_per_task, redundant_ratio | OTel spans | Message channel |
| Topology effectiveness | Actual vs optimal comm path | Orchestrator logs | Orchestrator decisions |
| Conflict detection | contradiction_rate | LLM-as-judge | Post-handoff checkpoint |
| Loop deadlock detection | repeat_query_similarity > 0.85 | Embedding similarity | Before each tool call |
The coordination layer answers: Is information between Agents lossless? Is communication redundant? Is the orchestration topology effective? Are any Agents contradicting each other? Are any Agents repeatedly invoking the same tool?
Individual Layer: Single-Agent Task Execution Observation
| Observation Point | Metric | Tool | Instrumentation |
|---|---|---|---|
| Step-level trace | step_count / duration / type | Langfuse / agent-run | ReAct loop |
| Decision quality | tool_selection_accuracy | Manual annotation + LLM eval | After thought |
| Drift detection | drift_score | Behavioral pattern analysis | Every N steps |
| Tool call audit | tool / params / result / duration | Deconvolute / OTel | Tool interception layer |
| Token consumption distribution | tokens_by_step | Langfuse | LLM usage field |
| Error & recovery | error_type / retry / recovery_success | Error logs | Catch block |
The individual layer answers: Is each step of a single Agent in the right direction? Are tool selections reasonable? Is token consumption concentrated in a few steps? Can the Agent auto-recover after errors?
Instrumentation Code Example
Using OpenTelemetry + OpenInference-style instrumentation, here's how step-level tracing and drift detection play out in the individual layer:
@trace("agent.step")
async def execute_step(agent_id, step):
    span = trace.current_span()
    span.set_attribute("agent.id", agent_id)
    span.set_attribute("agent.step_num", step.num)
    span.set_attribute("agent.step_type", step.type)
    if step.type == "tool_call":
        span.set_attribute("tool.name", step.tool_name)
        span.set_attribute("tool.duration_ms", step.duration_ms)
        span.set_attribute("tool.success", step.success)
    if step.num % 5 == 0:
        drift = await assess_drift(step.task_goal, agent_history)
        span.set_attribute("agent.drift_score", drift.score)
        if drift.score < 0.5:
            span.add_event("drift_warning", {"step": step.num})
Key design: every step records base attributes (agent id, step number, type), tool calls add tool name and duration, and drift detection fires every 5 steps — the frequency is tunable, representing the tradeoff between cost and precision.
Connection to DD1 / DD2
These three observation layers are not isolated — they form a closed loop with the first two articles in this series:
- Agent-layer "abnormal step count increase" → DD1 cost alert: When the individual layer's step_count spikes, it maps directly to the token cost anomalies described in DD1. The individual layer is a leading indicator for DD1 cost alerts.
- Agent-layer "reasoning quality degradation" → DD2 engine profiling: When drift_score consistently worsens, the root cause may be declining KV cache hit rates or batch scheduling issues in the underlying inference engine. DD2's engine-level metrics (GPU utilization, cache hit rate) provide the root-cause explanation for Agent quality degradation.
- Agent-layer "handoff information loss" → architecture improvement signal: If the coordination layer's information_retention_ratio consistently falls below 30%, the multi-Agent architecture itself needs redesign — this isn't solvable by tuning parameters; it's an architectural decision.
From DD1's "where does the money go" to DD2's "why is the engine slow" to DD3's "why does the Agent drift," the three observation layers together form a complete AI observability system.
Tool Landscape and Challenges
Current state: Langfuse supports basic Agent tracing — thoughts and tool calls can be recorded via manual instrumentation, with a ClickHouse backend for queries. agent-run defines a purpose-built Agent trace schema (Run → Step → Thought/ToolCall/Handoff), but remains at the standard stage with no mature engineering implementation. Deconvolute approaches Agent observability from a security angle, providing policy-as-code auditing of MCP tool calls — the most reliable interception and logging source at the tool-call layer. Atla does real-time visualization of Agent thoughts, exploring drift detection. But most Agent frameworks (LangChain/AutoGen/CrewAI) offer very thin built-in observability — essentially "log printing" level tracing, lacking structured spans and semantic attributes.
Challenges:
-
No de facto standard for Agent traces. Each framework uses its own format: LangChain's LangSmith trace, AutoGen's conversation log, CrewAI's execution log are structurally incompatible. Data doesn't interoperate — you can't use Langfuse to simultaneously view LangChain Agent and AutoGen Agent traces without manual adaptation.
-
Thoughts are unstructured text that existing tools can only record, not analyze. An 18-step Agent task produces 18 thought segments totaling ~3,000–5,000 tokens. Automatically assessing thought quality (relevance, accuracy, logical coherence) requires an additional LLM call — expensive in both cost and latency. As a result, thought analysis only happens occasionally in post-hoc audits, not as real-time monitoring.
-
Drift detection recall is too low. Behavioral pattern anomalies can only detect structural problems — loops (search → fetch → search repeated), spinning (consecutive thoughts with no tool calls), skipping (jumping to conclusions without validation). But semantic-level drift — like Step 4 confusing Company A's and Company B's product lines — shows completely normal behavioral patterns (tool call types and frequencies are unremarkable). Only semantic understanding of the Agent's reasoning can catch this. Such drift still requires manual review.
-
Multi-Agent handoff information loss isn't quantified by any existing tool. When one Agent hands results to the next, current tools only record "a handoff occurred" and "what data was transferred" — not "what percentage of Agent A's cognitive state reached Agent B." Without an automated information_retention_ratio metric, information loss is an invisible problem.
Requirements for the tooling ecosystem:
- An OTel-compatible Agent trace standard — enabling Agent traces to flow into existing observability infrastructure (Jaeger/Tempo/Datadog) rather than only being viewable in specialized tools. OpenInference is driving this direction, but Agent-specific thought/decision/handoff fields remain unstandardized
- Low-cost thought quality assessment — using lightweight models (e.g., 1–3B parameter classifiers) for real-time thought quality scoring instead of invoking a full LLM every time. This requires finding the right balance between accuracy and cost
- Automated handoff information fidelity metrics — automatically computing the information_retention_ratio from Agent A to Agent B, transforming information loss from an invisible problem into a trackable metric
Verdict: The Biggest Market Gap of 2026
Agent observability is the area in AI infrastructure with the most urgent demand and the least adequate supply.
LLM application observability (Langfuse/Phoenix) is relatively mature. Inference engine profiling (Graphsignal/vLLM metrics) is rapidly maturing. But Agent observability — thought tracking, drift detection, loop deadlock discovery, handoff information loss — is still in very early stages.
The standards war is the core battle. OpenInference is trying to bring Agent traces into the OpenTelemetry ecosystem. agent-run is defining its own Agent-specific schema. Langfuse uses its own trace format. If standards unify, data can flow between tools and tools can compose. If fragmentation persists, every Agent framework builds its own observability silo — just like every company building their own RPC tracing in the microservices era.
Who will win? My read:
- Short-term (6 months): Langfuse, with open source + framework-agnostic + first-mover advantage, becomes the de facto standard for LLM/Agent observability. Similar to Jaeger in the microservices era.
- Medium-term (1 year): OpenTelemetry + OpenInference will drive standardization. Big players (Datadog/New Relic) enter through acquisitions.
- Long-term: Agent observability moves from "post-hoc analysis" to "real-time intervention" — auto-correcting detected drift, auto-injecting prompts for detected loops, auto-supplementing context for detected handoff information loss. Observability and execution are no longer separate.
For teams building AI Agents: start with Langfuse (or Phoenix) for basic tracing now, set checkpoints at critical nodes, and watch the agent-run standard's progress. Don't wait until Agents fail at scale in production to start building observability.
References
[1] Berger et al., "Why Do Multi-Agent LLM Systems Fail?" arXiv:2503.13657 (2025). UC Berkeley & Intesa Sanpaolo.
[2] Wang et al., "AgentConductor: Topology Evolution for Multi-Agent Competition-Level Code Generation", arXiv:2602.17100 (2026). Shanghai Jiao Tong University i-WiN & Meituan.
[3] Liu et al., "Lost in the Middle: How Language Models Use Long Contexts", arXiv:2307.03172 (2023). Stanford, UC Berkeley, Samaya AI.
[4] Chroma, "Context Rot: How Language Models Lose Accuracy Over Long Contexts", 2025. See chromaDB research.
[5] Salesforce Engineering, "Query-Driven Observability for Agentforce", 2025. See Salesforce Engineering Blog. Spark-based query engine + Notebook environment, processing 400M agent trace records.
This article is the final installment of the AI Observability series. Full series: Overview: Three Blind Spots · DD1: Anatomy of an Inference Bill · DD2: Inside the Inference Engine · DD3: Agent Decision Paths