
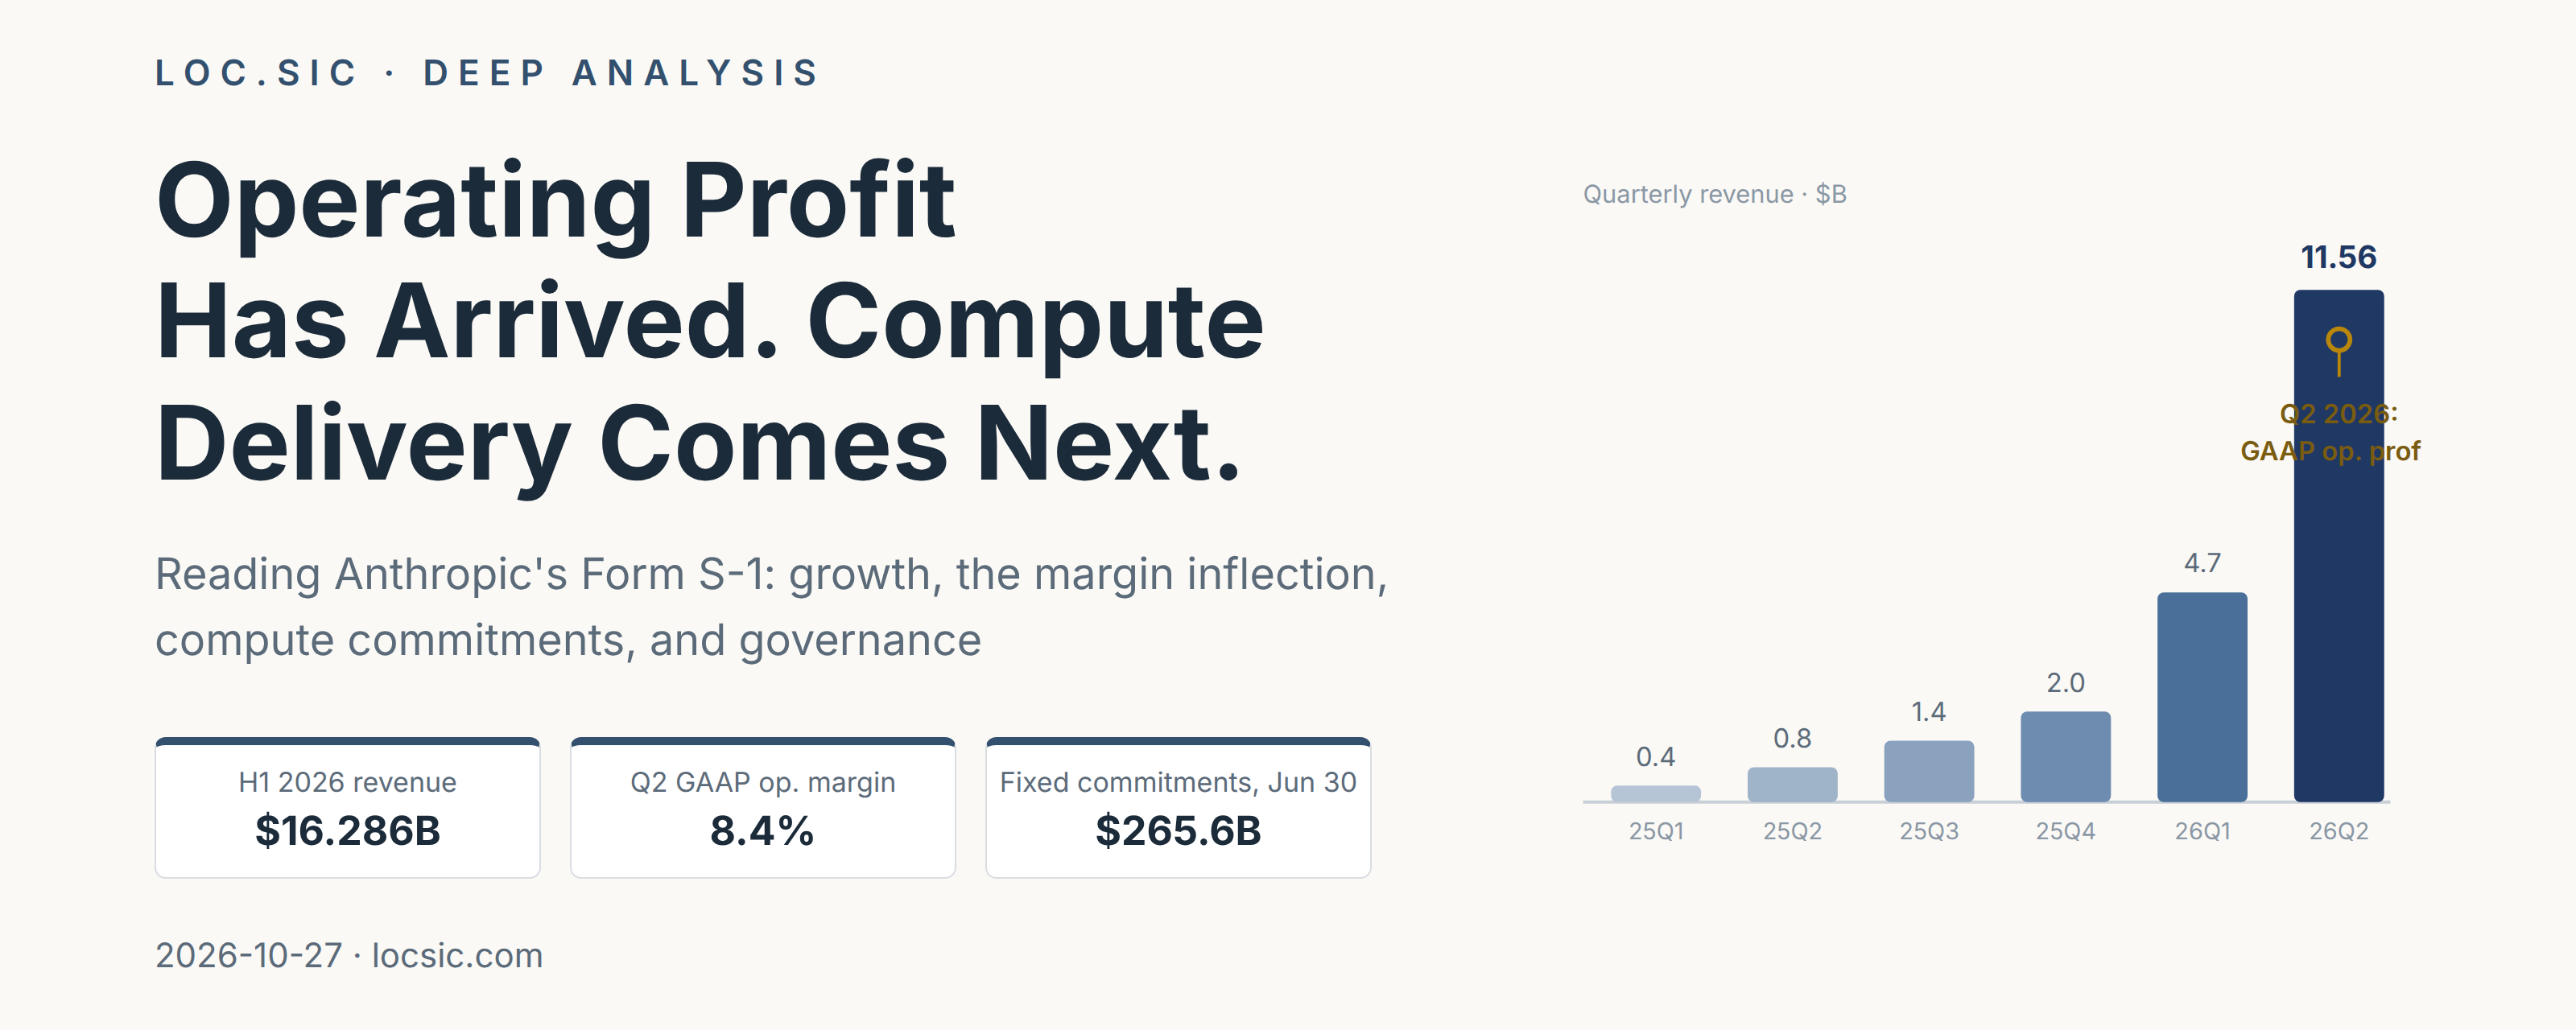
Based on the Form S-1 publicly filed by Anthropic PBC on October 26, 2026 | Data as of October 27, 2026
Core Conclusions
Anthropic reached GAAP operating profitability in the second quarter of 2026, yet it still posted an operating loss for the first half as a whole, and margins at maturity remain unproven. The enormous paper net loss is not the point. Three questions actually determine the value: whether customer usage keeps growing, whether model iteration stays ahead, and whether multi-year compute commitments turn into revenue that earns a profit.
1. Demand growth and monetization progress have hard evidence. The second quarter of 2026 delivered GAAP operating profitability, a larger customer base, and positive operating cash flow, and the three corroborate one another. Still, one quarter or one half of improvement does not prove the entire compute cycle will pay off.
2. This is not an ordinary subscription software company. A more accurate reading: usage-priced intelligence services, plus continuous frontier R&D, plus long-term infrastructure procurement. Judging it as subscription software overstates revenue predictability and understates cost rigidity. Judging it as a pure cash-burning story ignores the inflection that has already appeared.
3. The offering price is not set, so calling it cheap or expensive right now is premature. A defensible valuation needs to test four things at once: future revenue scale, sustainable net margin, fully diluted share count, and the governance constraints placed on common shareholders.
Key Operating Data
| Metric | Value | Reading |
|---|---|---|
| H1 2026 revenue | $16.286B | Up roughly 1,300% year over year, 14x the prior-year period |
| Q2 2026 GAAP operating profit | $0.974B | 8.4% operating margin, computed on a GAAP basis, not an adjusted one |
| H1 operating cash flow | $3.929B | Of which $1.168B came from net working capital changes |
| H1 gross margin (derived from functional expenses) | 85.4% | Excludes most R&D and channel costs; not an all-in margin |
| H1 total compute and infrastructure expense | $8.945B | 54.9% of revenue; overlaps with the functional expense presentation |
| Unrestricted liquidity at end of June | $131.651B | Ample funding, but it comes mainly from financing, not accumulated profit |
Source: S-1 pp. 150–169 and Note 8 to the financial statements. Amounts in USD unless stated otherwise. H1 means first half; Q means quarter. Growth rates, margins, and other ratios are the author's calculations.
1. The Business Model Determines Revenue Quality
What It Sells Is a Continuously Consumed Intelligence Service
Anthropic offers the Claude models and related tools through its own apps, an API, and third-party cloud platforms. Models are tiered by capability, speed, and cost. Customers mostly pay for the tokens they actually consume; they can also subscribe or sign minimum-commitment contracts. What it sells is not software bought once and owned forever; revenue recurs with the customer's workload.
| H1 2026 | Revenue ($B) | Share | Economic character |
|---|---|---|---|
| Usage revenue | 13.064 | 80.2% | Moves with usage. New capabilities and workflows drive growth, but price cuts and efficiency gains can offset it |
| Subscription revenue | 3.222 | 19.8% | Terms generally under 12 months; usage allowances reset periodically, with top-ups available |
| Total | 16.286 | 100% | The whole of this revenue should not be read as locked-in annual recurring revenue |
Growth Has to Be Split into Capability, Usage, and Price
Better model capability widens the range of tasks the models can complete, bringing more customers, longer inference runs, and more tool calls. Better inference efficiency can reduce the tokens and compute a single task needs. Total revenue therefore hinges on one question: can new workload grow faster than the falling price and consumption per task? Token counts or benchmark rankings alone cannot tell you what profit shareholders get.
Management disclosed that in Q3 2026 more than 80% of revenue came from model versions released within the previous six months. Revenue migrates quickly to new models, which makes continuous iteration a condition of staying competitive. Ongoing R&D is therefore a necessary long-term input, not an easily cut expense. Safety evaluations can also delay or restrict model releases, which in turn affects when revenue is realized.
Distribution Speeds Revenue Growth and Affects Profit Comparability
About 48% of H1 revenue came through cloud platforms. In these arrangements the company signs directly with the customer, sets the price, and bears the performance obligation, so revenue is recognized on a gross basis. The cloud platform handles billing and distribution, and its fees are not deducted from revenue. When comparing revenue and gross margins across AI companies, first confirm whether channel revenue is recognized gross or net; only like-for-like presentations compare.
The company reports a single operating and reportable segment, with no separately audited income statement for Claude Code, the API, or any other application. The disclosures show monetization accelerating overall, but they cannot prove that any single product is profitably stable on its own. The company cites the economic value of knowledge work as exceeding $40 trillion. That is a potential value pool, not what enterprises will budget for AI, and even less what this company will collect.
Source: S-1 pp. 139, 142, 144; revenue recognition notes F-21–22; Note 2 (F-27); Note 14 (F-62). The comparability and value-pool judgments are the author's analysis.
2. Rapid Growth Has Already Changed the Scale of Operations
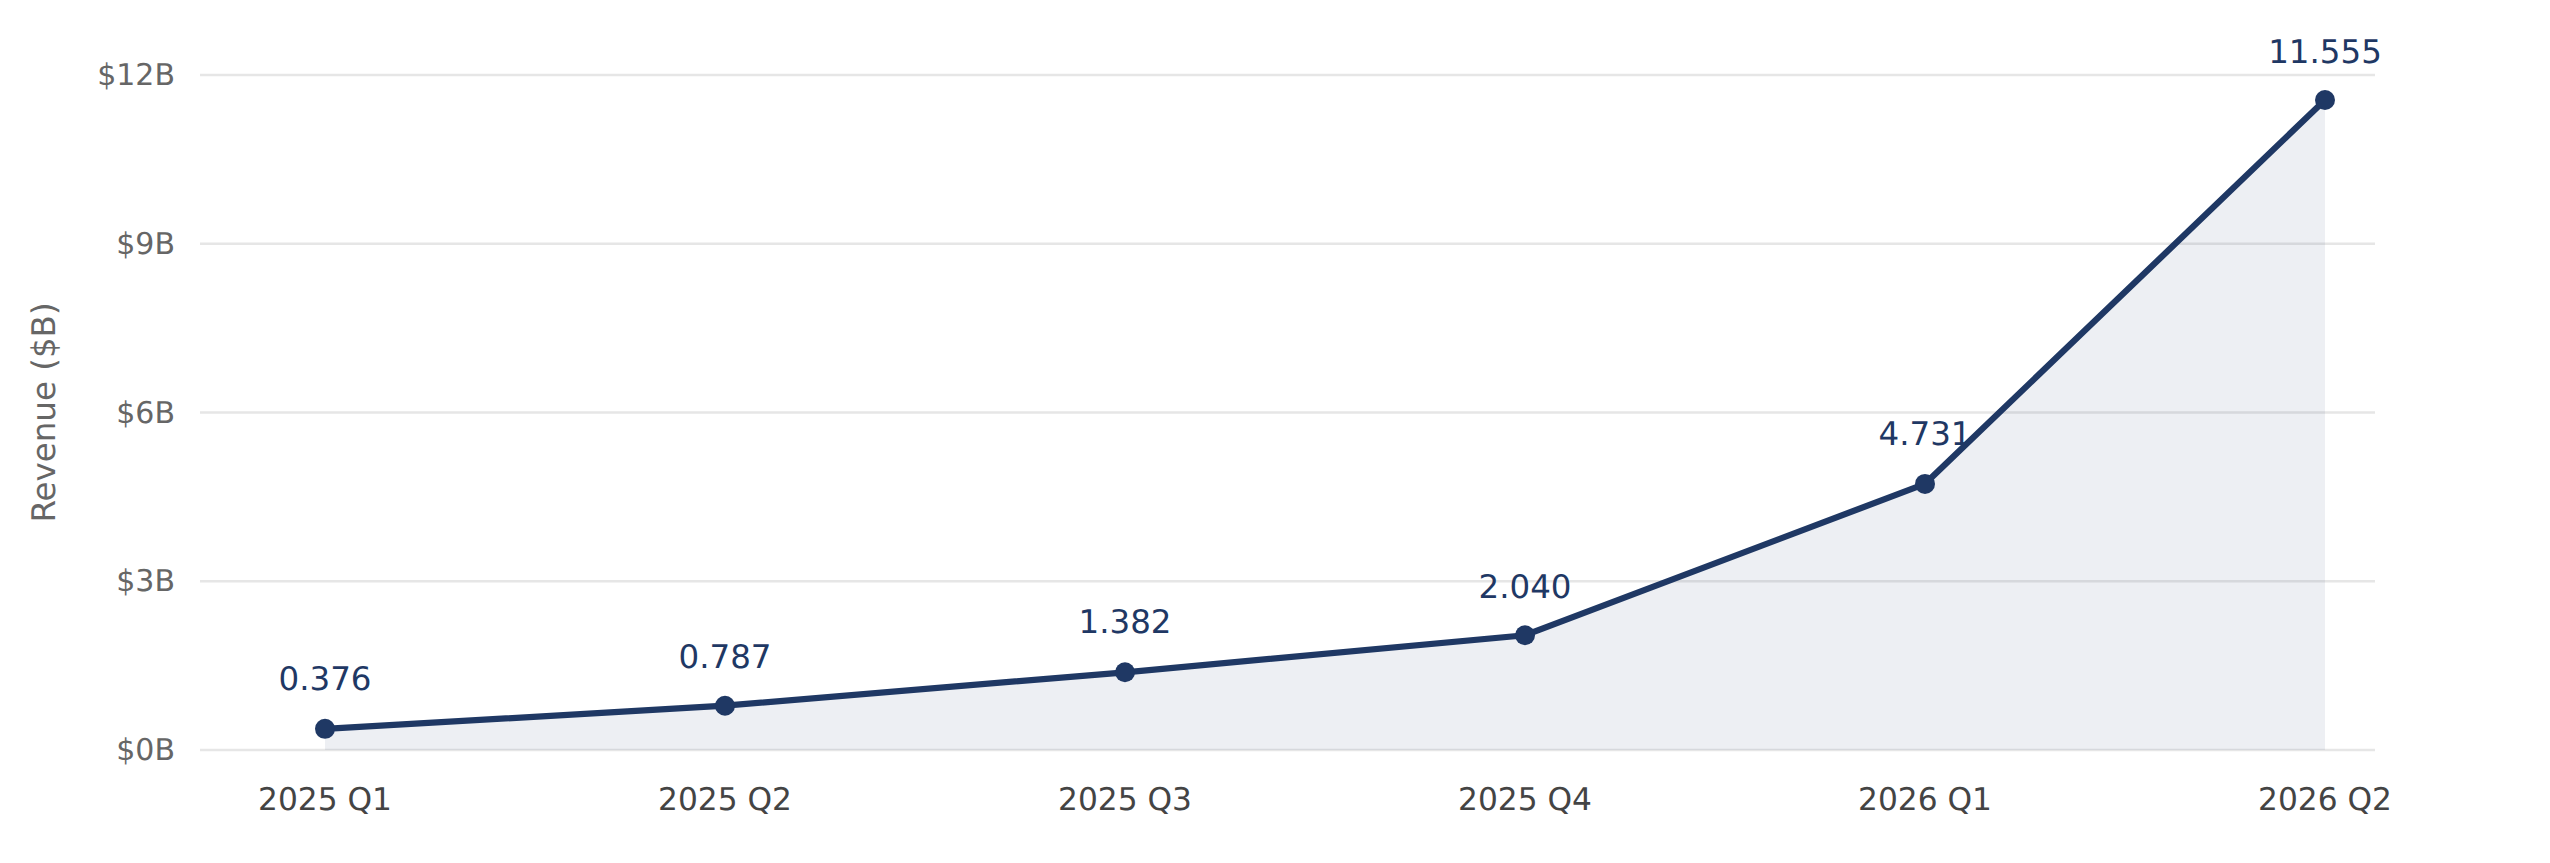
Full-year 2025 revenue was $4.585B; the first half of 2026 alone reached $16.286B. More important, quarterly revenue kept rising quarter after quarter rather than leaning on an annualized figure at a single point in time. Q2 revenue grew 144.2% quarter over quarter and 1,368.2% year over year.
| Quarter | 2025 Q1 | 2025 Q2 | 2025 Q3 | 2025 Q4 | 2026 Q1 | 2026 Q2 |
|---|---|---|---|---|---|---|
| Revenue ($B) | 0.376 | 0.787 | 1.382 | 2.040 | 4.731 | 11.555 |
The Scale Jump Is Real but the Current Slope Should Not Be Extrapolated
Revenue has grown clearly faster than compute expense over the same period, leaving room for operating leverage. But new model releases, customer expansions, new compute coming online, and seasonality all move short-term usage. Management disclosed that in early 2026 customer spending in one two-week window fell about 20% from the prior two weeks. Fast growth hides seasonality easily; assume no quarter simply repeats the latest sequential growth rate.
The latest complete financial statements run through June 30, 2026. The prospectus carries customer and operating narrative through September, but aggregate Q3 financials and some end-of-October Run-Rate figures are blank. Blank means undisclosed, not zero, and media reports from other dates are not a substitute.
Source: S-1 pp. 144, 158 and recent operating disclosures. Quarterly figures are unaudited; year-over-year and quarter-over-quarter rates are the author's calculations.
3. The Operating Inflection Matters More Than the Paper Net Loss
Q2 Already Achieved GAAP Operating Profitability
| Metric ($B) | FY 2025 | H1 2026 | Q2 2026 |
|---|---|---|---|
| Revenue | 4.585 | 16.286 | 11.555 |
| GAAP operating profit (loss) | −8.060 | −0.693 | 0.974 |
| GAAP operating margin | −175.8% | −4.3% | 8.4% |
| Adjusted operating profit (loss) | −4.854 | 1.618 | 2.235 |
| Adjusted operating margin | −105.9% | 9.9% | 19.3% |
The $0.974B Q2 operating profit is a real GAAP result. The first half still shows a small loss because Q1 carried an operating loss of $1.667B. The adjusted figures strip out stock-based compensation and similar items, useful for watching some cash-cost trends, but they do not replace GAAP. H1 stock-based compensation reached $2.185B, a real economic cost to shareholders.
Fair-Value Changes Do Not Touch Operating Profit
Fair-value changes on convertible notes, derivative liabilities, and SAFEs totaled $72.388B, recorded below operating profit, and mainly reflect movements in financing instruments. None of it is current training spend, nor an equivalent cash outflow, and it should not be mixed up with operating expense. The next table only explains how the net loss was assembled; it is not evidence of operational deterioration.
| H1 2026 net loss reconciliation | $B |
|---|---|
| GAAP operating loss | −0.693 |
| Interest income | 1.111 |
| Fair-value change on convertible notes, derivative liabilities, and SAFEs | −72.388 |
| Other expense, net (mainly revaluation of other financing instruments) | −8.757 |
| Income tax | −0.021 |
| GAAP net loss | −80.748 |
What shareholders should care about is the terms on which these instruments convert and how many shares exist after full dilution, not deducting this loss from enterprise value a second time. A fair-value loss does not equal that much new dilution in the period. If the valuation already uses post-conversion fully diluted shares, deducting it again double-counts. To judge operations, return to operating profit, cash flow, and future capital needs.
Source: S-1 pp. 156–161; financial statements and Note 8 (F-38). Margins are the author's calculations. Excluding the revaluation impact does not mean ignoring conversion terms and potential dilution.
4. A High Gross Margin Is Not an Asset-Light Model
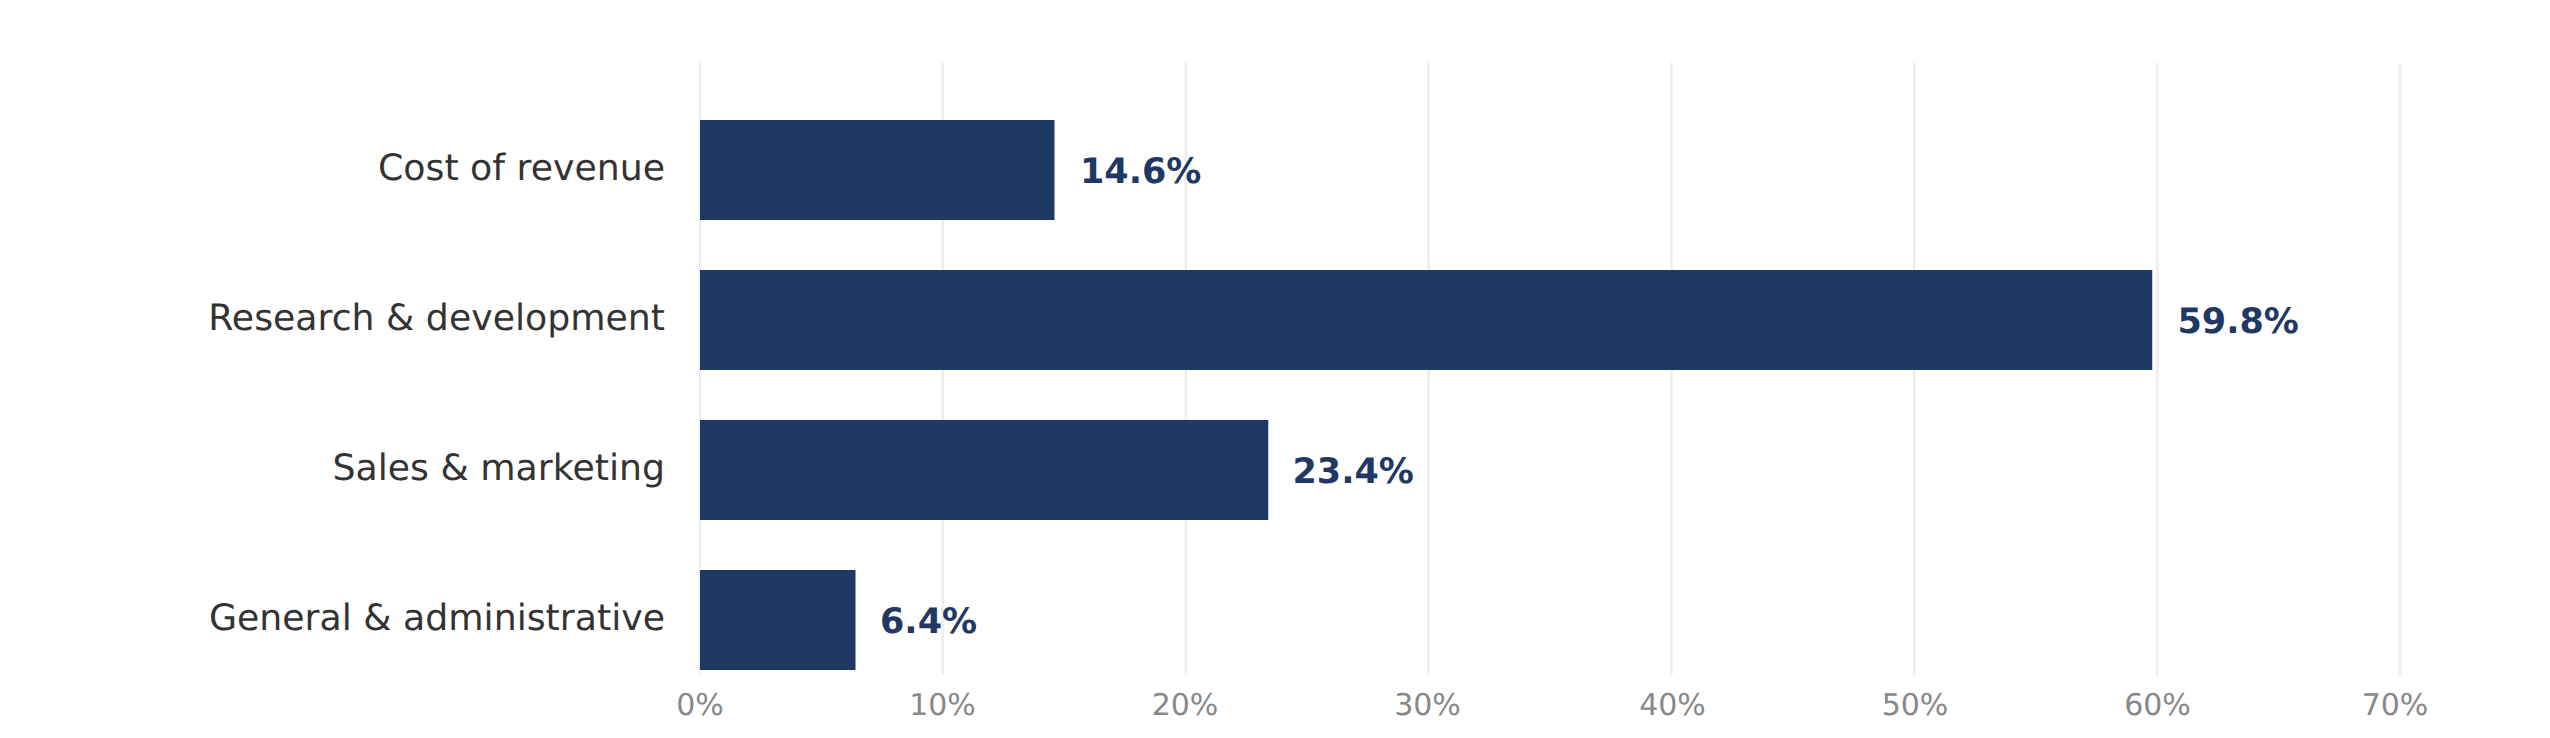
From 2025 the prospectus presents the income statement mainly by expense nature, with expenses by function kept in the notes. This changes presentation only; operating loss, net loss, and cash flow are unchanged. Measured from cost of revenue in Note 8, the H1 2026 gross margin was 85.4%, against 39.5% for full-year 2025. The number is informative, but only read together with where each expense is recorded.
| Functional expense | Amount ($B) | Share of revenue | Main content |
|---|---|---|---|
| Cost of revenue | 2.380 | 14.6% | Mostly compute serving customers, plus some personnel and allocated costs |
| Research and development | 9.741 | 59.8% | Model development, research, internal compute, personnel, and similar |
| Sales and marketing | 3.808 | 23.4% | Channel partner costs, compute for free usage, advertising, personnel, and similar |
| General and administrative | 1.050 | 6.4% | Administrative personnel and other management costs |
Costs From Different Presentations Cannot Be Added Together
The $8.945B of compute and infrastructure expense is aggregated by nature, while R&D and cost of revenue are functional categories; the two presentations overlap. Do not sum the three, and do not treat all R&D as training cost. Revenue minus total compute expense leaves about 45.1%, which is not a GAAP gross margin either, because it includes research and internal-use compute.
Judging whether the company can be profitably stable requires watching four costs at once: inference cost serving customers, the frontier R&D that must continue, channel costs, and stock-based compensation. The 85.4% gross margin shows that, on this accounting presentation, the contribution of services already sold is strong. It does not show an 85% all-in company margin, and it does not compare directly with software companies whose channel costs are classified differently.
Source: Note 1 (F-15); Note 8 (F-40); S-1 pp. 146, 150–151. The ratios, gross margin, and residual share are the author's calculations.
5. The Cash Flow Improvement Is Real but the Funding Sources Must Be Told Apart
Operating Cash Flow Is Not the Same as Durable Free Cash Flow
| H1 2026 cash flow decomposition | $B | Reading |
|---|---|---|
| After non-cash items, before working capital changes | 2.761 | The operating business's ability to generate cash is improving |
| Increase in accounts receivable | −4.982 | Part of the revenue growth has not yet been collected in cash |
| Prepayments and other asset changes | 2.094 | Partly from prepayments being released |
| Payables, accruals, and other liability changes | 2.679 | Unpaid payables and accruals contributed positively to operating cash flow |
| Increase in deferred revenue | 1.380 | Cash from customer prepayments |
| Operating lease liability changes | −0.003 | Net movement tied to operating leases |
| Operating cash flow | 3.929 | Working capital contributed a net $1.168B |
| Less: cash purchases of property and equipment | −0.482 | Cash purchases of property and equipment only |
| Simplified cash surplus | 3.447 | The author's calculation, not the company's standardized free cash flow metric |
About 29.7% of operating cash flow came from net working capital changes. The improvement is not entirely a story of supplier payment terms, but it also cannot all be treated as durably repeatable earnings. After further deducting $0.004B of finance-lease principal, the simplified cash surplus is $3.443B. As finance leases on equipment begin to be paid, infrastructure-related cash outlays will rise; principal repayment sits in financing activities and is not the same as cash capex for equipment. Low cash capex today says nothing about the future infrastructure burden.
Ample Cash Buys Time but Does Not Remove the Cost Risk
At the end of June, cash and equivalents were $112.389B, plus $19.262B of short-term investments, for $131.651B of unrestricted liquidity. Another $2.529B sits in restricted cash and must be viewed separately. H1 preferred stock issuance raised $110.432B net, evidence that the cash pile is mostly investor capital, not profit earned and retained.
A large cash position improves the company's ability to absorb technology shifts and capacity ramp-ups, but multi-year purchase commitments do not become low-risk spending because of it. Testing solvency means comparing available cash, operating cash flow, contractual payments, and lease commencement dates year by year. Simply subtracting every announced contract value from the cash balance produces nothing meaningful.
Source: Consolidated statements of cash flows (F-13–14); consolidated balance sheet (F-6); S-1 p. 169. The working capital contribution and simplified cash surplus are the author's calculations.
6. Customer Expansion Is Strong but the Retention Metric Must Be Read Carefully
Unless noted, the customer metrics below are as of September 30, 2026.
| Metric | Disclosed result | Notes |
|---|---|---|
| Customers with TTM revenue above $100,000 | More than 11,900 | Against more than 950 in September 2025, a clear widening of coverage |
| Customers with TTM revenue of at least $1 million | More than 1,900 | A substantial enterprise customer base has formed |
| Customers with TTM revenue of at least $10 million | About 250 | Deep usage is no longer confined to a handful of customers |
| Net revenue retention (NRR) through September | Roughly 900% | The same-cohort customers' quarterly revenue is about 9x a year earlier |
| Largest single customer, first nine months of 2026 | No more than 10% of revenue | End-customer concentration has fallen, but channel dependence has not disappeared |
| Remaining performance obligations (RPO) at end of June | $10.8B | About 75% expected to be recognized within 12 months |
NRR Measures Revenue Expansion, Not User Retention
The metric compares revenue from the same base-period cohort of customers in Q3 2025 and Q3 2026. It includes expansion, contraction, and churn; it excludes customers added later, and it excludes Claude Pro and Max subscribers. So 900% means revenue is about 9x the original, or growth of about 800%, not 900%. A low early base plus rapid usage growth both inflate the number; do not expect it to stay stable the way mature software companies' retention does.
End Customers Are Diversifying While the Channel Remains Concentrated
In the first nine months of 2026, the top five end customers still contributed about a quarter of revenue. Meanwhile, 48% of H1 revenue and 58% of receivables at the end of June flowed through cloud platforms. The former reflects end-demand concentration; the latter reflects dependence on cloud platforms for customer reach, billing, and migration. Note that revenue distributed through cloud platforms must not be misread as revenue from the cloud vendors buying for themselves.
Remaining performance obligations reveal part of future revenue, but they are not a forecast and do not include all potential usage. Plenty of revenue still arrives with actual consumption, and some large customers have no long-term contract, or contracts close to expiry. What is worth tracking: how much revenue minimum-commitment contracts cover, whether the older customer cohorts keep expanding, churn, and whether growth comes from production workloads backed by long-term budgets.
The company estimates 5%–7% of revenue in the first nine months of 2026 came from customers later found to have violated usage policies or commercial terms, and it tightened enforcement in August and September. Treat this as a test of revenue quality and of how the future revenue base may change; it cannot be called fraudulent revenue, and the ratio should not be applied to the first half.
Source: S-1 pp. 3–4, 57–58, 135–136, 143–146; Note 2 (F-27). The customer-threshold metrics and the quarterly NRR use different statistical windows.
7. Compute Contracts Must Be Read Clause by Clause, Not Summed by Headline Amount
Beyond buying compute from cloud platforms, the company is advancing Anthropic Direct: leasing equipment directly, with third parties developing and operating dedicated facilities. Using multiple chip families reduces dependence on any single architecture while raising scheduling, migration, and operational complexity. The risk level depends not on who the vendor is but on minimum payments, cancellation rights, delivery conditions, and billing start dates.
| Partner | Disclosed size ($B) | Key terms and constraints |
|---|---|---|
| Microsoft | At least 44.9 | November 2026 to May 2033; commitments must be honored regardless of usage, with limited exceptions |
| At least 114.5 | April 2026 to July 2033; shortfalls made up per the agreement | |
| Amazon | At least 110.0 | May 2026 to April 2036; shortfalls made up per the agreement |
| Broadcom | Rentals of 161.2 (excluding interest) | Five-year finance lease of equipment; non-cancellable except for default; rent can start even if some facilities are delayed |
| SpaceXAI | Up to 120.5 | Through 2029; after the initial non-cancellable period, either party may cancel on 90 days' notice |
| Nscale | Up to about 44.6 | Through 2033; billing starts after delivery acceptance, subject to financing, delivery, and availability conditions |
| Lambda | About 41.3 | Through 2034; billing starts after delivery acceptance, with some agreements carrying facility leases and other conditions |
Contract Amounts From Different Definitions Cannot Be Added Directly
- At the end of June, fixed or minimum-guaranteed purchase commitments were $265.6B.
- Leases not yet commenced carried $321.4B of future undiscounted payments.
- Agreements added or modified after the end of June carried minimum future payments of about $245.0B, plus about $21.0B of near-term minimum non-cancellable payments.
These items overlap with the supplier-by-supplier contract disclosures and differ in measurement date and the scope of amendments covered; they cannot be added together. Nor are purchase commitments all recognized balance-sheet debt.
In addition, future TPU capacity is expected to reach $125.0B–$150.0B, and AMD initial capacity is expected to exceed $20.0B if fully purchased. These are conditional or estimated outlays and should not be treated as fixed, certain obligations. The prospectus's contractual-obligations summary table and some future-year amounts are still blank; until the company formally discloses them, do not invent a deceptively precise total.
Source: S-1 pp. 171–172, 205–206; Note 7 (F-36); Note 13 (F-59); Note 17. The table lists differently defined contract disclosures; they cannot be summed and are not all recognized balance-sheet debt.
8. The Core Risk: Duration Mismatch Between Revenue and Compute
Compute Is Locked In First; Demand Arrives Later
Most compute must be contracted 12 to 18 months ahead. When new capacity comes online, related expense can jump in a concentrated way, while the revenue tends to arrive later. The company explicitly warns that newly arriving compute may compress operating margins, and that when demand exceeds contracted capacity it must buy more expensive short-term compute. Operating leverage therefore does not necessarily improve all the way as scale grows; it may improve first, then come under pressure.
Revenue is short-cycle and usage-based; procurement is multi-year minimum commitment. The two are mismatched by construction. Model price cuts, per-task efficiency gains, customers switching models, or tighter policy enforcement can all pull revenue down while minimum purchases and some rents remain due. The other way round, if demand keeps growing, capacity arrives on time, and utilization stays high, locking compute in early can become an advantage in both cost and supply security.
| Operating scenario | Signals to watch | Effect on the economic model |
|---|---|---|
| Demand ahead of compute | Throttling, queues, rising share of short-term compute | Big revenue opportunity, but expensive temporary purchases can compress margins |
| Demand in step with compute | Stable utilization, improving gross profit per task | Best case for realizing operating leverage, though R&D must continue |
| Compute ahead of demand | New capacity online while revenue growth slows | Fixed and minimum payments bind; profit and cash come under pressure together |
| Delivery later than billing start | Facilities delayed while leases already accrue | Costs arrive before revenue, requiring extra liquidity |
Chips and Order Headlines Are Not Enough
Grid interconnection, energy and water, facility completion, equipment availability, software adaptation, and hardware architecture refreshes all shape actual output. Agentic workloads tend to run longer inference chains, more tool calls, and longer context. The prospectus warns that compute demand may grow faster than the corresponding revenue. Revenue and cost per task therefore say more about the real economics than any single token price.
AWS, Google, and Microsoft are simultaneously the company's investors, suppliers, customers, distribution platforms, and competitors. This helps financing and sales while creating risks around bargaining power, compute allocation priority, data visibility, and regulation. Absent evidence, do not label the related revenue fake circular transactions. The more useful diligence question: if capital support or channel incentives weaken, do end demand and unit economics still stand?
For the AI infrastructure industry, these contracts are powerful evidence of demand scale, but they do not guarantee every order converts into supplier revenue on schedule, still less that any supplier's valuation is justified. Delivery conditions, cancellation rights, and financing terms need contract-by-contract evaluation.
Source: S-1 pp. 30–33, 74–75, 146–147, 171–172, 205–206. The scenario analysis and investment implications are the author's judgment, not company projections.
9. Shareholders Hold Economic Rights, Not Equivalent Control
| Share class or holder | Economic rights | Governance rights |
|---|---|---|
| Publicly held Class A shares | Common economic interest | One vote per share, but practical influence constrained by the Class F and Class T structure |
| Class N shares | Economic rights similar to Class A | Generally no ordinary voting rights; convert to Class A on qualifying transfer |
| Class F shares held by the Founder LLC | No economic interest | Dynamically maintained at 50.1% of the general voting power |
| Class T shares held by the LTBT (Long-Term Benefit Trust) | No economic interest | Appoints and removes a majority of directors under specific procedures and limits |
| Class E shares held by employees | No economic interest | Voting rights on certain special governance matters |
Compared With Usual Dual-Class Structures, Control Is Harder to Dilute Economically
Issuing more Class A or Class N shares, or the founder selling economic interest, generally does not dilute the F shares' control or the T shares' director-appointment rights. The LTBT and founder structures together shape board composition. That does not mean public shares carry no vote, nor that the LTBT runs daily operations. The company still plans to keep a board majority independent, with audit and compensation committees fully independent.
The structure has termination and amendment mechanisms. If qualifying founders fall below three for 90 continuous days, a 450-day transition period begins; the T shares' rights can also be amended or redeemed through high-threshold approvals. The practical effect: public investors' ability to change the company's direction through voting, acquisition, or activist campaigns is weaker than in an ordinary single-class company.
The Public-Benefit Mission Affects Resource Allocation and Dilution
As a public benefit corporation, directors must balance shareholder economic interest, affected parties, and the long-term responsible development of AI. The company has contributed 846.8 million Class N shares to a wholly owned public benefit fund, about 5% of fully diluted shares at the end of June under the agreed convention. While held inside the group these shares do not count as outstanding in consolidated statements; transfer or donation to outside parties would need separate assessment.
Each time the share price rises another 50% above the previous milestone, the board may contribute up to 2% of a defined share base at its discretion. Triggers require the average price over at least 90 of 120 trading days, and over the prior 10 days, to meet the threshold. A 50% intraday move does not automatically dilute. The founder's personal commitment to donate personal wealth or personal equity value does not mean the company will issue new shares equal to 80% of itself.
For shareholders, both the benefits and the constraints of this structure belong in the valuation. A long-term mission may dampen short-termism, but it also means maximizing shareholder value is not the company's only objective. Public-benefit outlays, employee equity incentives, financing-instrument conversions, and future issuances all belong in a fully diluted per-share value model, not just an overall company value.
Source: S-1 pp. 13–20, 108–110, 144–145, 235–246, 292–307; the consolidated accounting convention for the initial public benefit issuance is footnoted on p. 24. Investment implications are the author's analysis.
10. Valuation Starts With the Revenue Definition and the Assumptions
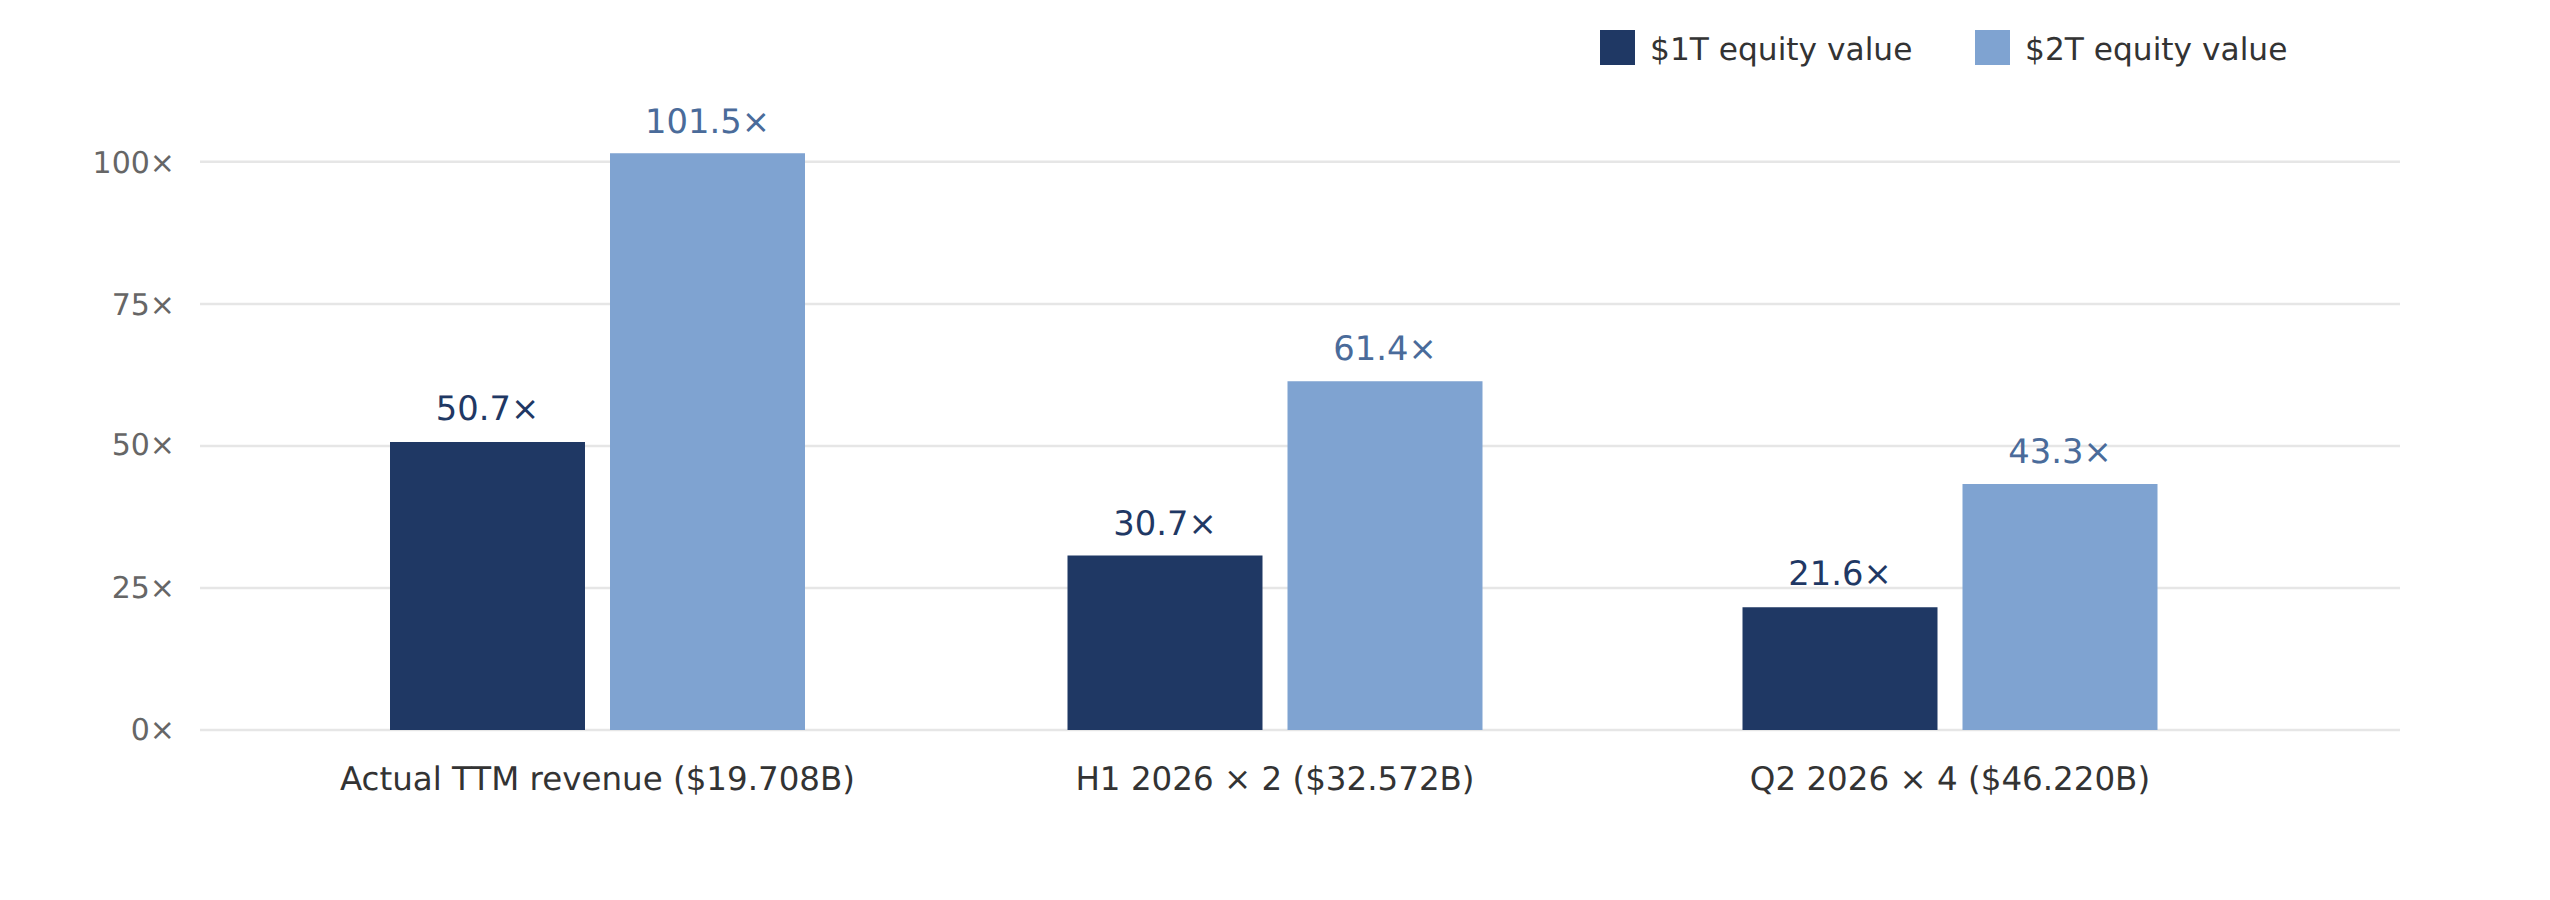
This version of the prospectus sets no offering price, share count, or complete post-offering capitalization. The sensitivity analysis below uses $1T and $2T equity values only to show what operations the valuation implies. It is not an IPO term, a price target, or a forecast.
| Revenue definition | Revenue ($B) | At $1T equity value | At $2T equity value |
|---|---|---|---|
| Actual trailing twelve months through June | 19.708 | 50.7x | 101.5x |
| H1 revenue × 2 | 32.572 | 30.7x | 61.4x |
| Q2 revenue × 4 | 46.220 | 21.6x | 43.3x |
The first row is revenue already realized; the other two are simple annualizations. Neither is a company forecast. The company separately defines Run-Rate as trailing 28-day usage revenue × 13 plus current-month subscription revenue × 12. It is not GAAP annual revenue and not necessarily contractually locked ARR. Figures from different dates and definitions must not be mixed in one revenue denominator.
Working Backward From Profit to the Required Scale of Operations
Assume a mature net margin of 20% and a 40x price-to-earnings multiple: supporting a $1T equity value takes about $25.0B of net profit, implying about $125.0B of revenue; supporting $2T takes about $50.0B of net profit, implying about $250.0B of revenue. This demonstrates the operating scale the valuation implies, not a forecast. The later profits arrive and the more dilution occurs, the lower today's per-share value.
These are price-to-sales ratios on equity value, not EV multiples. Computing enterprise value requires consistent treatment of cash, debt, financing-instrument conversions, and leases. With offering terms incomplete, a deceptively precise per-share value is not warranted. The non-cash revaluation discussed earlier should not be deducted again on top of fully diluted shares. But sustained R&D, stock compensation, and public-benefit commitments cannot simply be stripped out of sustainable profit either.
Source: Revenue figures from the S-1 financial disclosures; Run-Rate definition on p. 5; offering terms on the cover and pp. 126–131. The multiples are the author's calculations; the assumptions are stated in the text.
11. What to Verify Next
| Verification question | Positive signals | Warning signals |
|---|---|---|
| Can operating profit persist | GAAP profit keeps improving after new compute comes online | Revenue growth slows while expenses jump with new compute |
| Is revenue quality improving | Existing customers keep expanding; minimum-commitment contracts and RPO grow | Growth leans on a few customers or short trial traffic |
| Does R&D keep paying off | New models drive retention, workflow adoption, and better unit economics | R&D keeps rising while lead time shrinks |
| Does compute provisioning match demand | On-time delivery, high utilization, falling cost per task | Facility delays, idle capacity, more expensive short-term purchases |
| Can cash cover the commitments | Operating cash flow matches year-by-year payment schedules | Persistent prepayments and finance leases push cash needs up |
| Can per-share value grow | Business grows faster than dilution and public-benefit contributions | Overall company value rises while total shares expand just as fast |
What the Next Prospectus Amendment Should Add
- Complete Q3 income statement and cash flow statement, plus a dated Run-Rate update.
- The complete contractual-obligations summary, next-twelve-month payment schedule, and lease commencement timeline.
- The offering price range, share count, and fully diluted figures covering preferred stock and convertible note conversions, options, and RSUs.
- Specific share counts for each lock-up release tranche, not just dates.
Lock-ups do not expire in one 180-day wave. Different holders face different arrangements: staggered automatic releases starting from the first trading day, with founders and similar holders usually locked longer. Some tranches' release counts are still blank in this version, so the tradable float and selling pressure after listing cannot yet be quantified, and one should not assume all existing shares trade freely on day one.
Legal and Operational Risks Feed Operating Costs
Copyright, privacy, security incidents, model misuse, regulation, and customer-policy enforcement can all move costs and revenue. The $1.5B Bartz settlement recognized in 2025 shows such risks are not abstract. That does not mean future losses will match it, but estimating steady-state profits requires a reasonable allowance for legal, safety, and compliance spending.
Closing
The operating inflection deserves credit, but final value depends on three things persisting through the same cycle: technical leadership, continued customer expansion, and high compute utilization. The four most useful indicators to track are operating margin, revenue growth net of quality problems, year-by-year cash obligations, and fully diluted per-share value. Arguing repeatedly over one non-cash revaluation adds little.
Sources and Measurement Notes
Primary source: the Form S-1 Anthropic PBC publicly filed with the U.S. Securities and Exchange Commission on October 26, 2026. This article analyzes that version; unfilled offering terms, financial data, and contract tables are not treated as zero, and news figures from other dates are not substituted.
Data categories:
- Disclosed data: financial amounts, customer counts, contract terms, and governance rules quoted directly from the prospectus. Historical annual statements are audited; interim and quarterly data are unaudited. Page numbers are the prospectus's original printed pagination; entries prefixed "F-" are the financial statement appendix pagination.
- Calculated data: year-over-year and quarter-over-quarter rates, margins, the gross margin derived from functional expenses, the operating cash flow decomposition, trailing-twelve-month revenue, and simple annualizations. Gross margin = (revenue − cost of revenue) ÷ revenue; TTM revenue through June = FY 2025 revenue − H1 2025 revenue + H1 2026 revenue. Rounding may cause small additive differences in tables.
- Analysis and assumptions: the conditions for sustained profitability, the duration mismatch, the risk scenarios, and the $1T and $2T equity values are not company commitments. The 20% net margin and 40x P/E only work backward to an implied operating scale; they imply nothing about timing, probability, or a discounted price target.
Prospectus section index:
| Topic | Location in the S-1 |
|---|---|
| Metric definitions and prospectus summary | pp. 1–25 (NRR on pp. 3–4, Run-Rate on p. 5) |
| Revenue model, customers, and product updates | pp. 135–146 |
| Annual and interim operating performance | pp. 150–157 |
| Quarterly trends and adjusted metrics | pp. 158–161 |
| Cash flow and liquidity | p. 169; financial statements F-6, F-13–14 |
| Compute suppliers and contractual obligations | pp. 171–172; Notes 7 (F-36), 13 (F-59), 17 |
| Expenses by function | Note 8 (F-40) |
| Revenue recognition and remaining performance obligations | Notes 1 (F-21–22), 2 (F-27) |
| Governance, public benefit, and share classes | pp. 13–24, 108–110, 235–246, 292–307 |
| Lock-ups and shares eligible for sale | pp. 307–310 |
This article is for research reference only and does not constitute an offer or recommendation to buy or sell any security. Investors should rely on the final offering terms and make independent judgments based on their own risk tolerance.