Anatomy of an Inference Bill
85% of your AI bill is infrastructure tax; only 15% creates value
Deep Dive 1 / 3 · This article is the first deep dive into The Three Blind Spots of AI Observability, focusing on the Token Economics blind spot.
$47,000 a Month
Let's look at a real bill.
A SaaS company, 300-person team, using GPT-5.5 API for internal tools (code assistant + document search + data analysis). Monthly API spend: $47,000. CFO says "optimize costs."
The team's first instinct: find a cheaper model. Swap GPT-5.5 for DeepSeek V4 at 1/20th the price. But that's the most superficial optimization. The real question is where that $47,000 actually went.
An X-Ray of the Token Bill
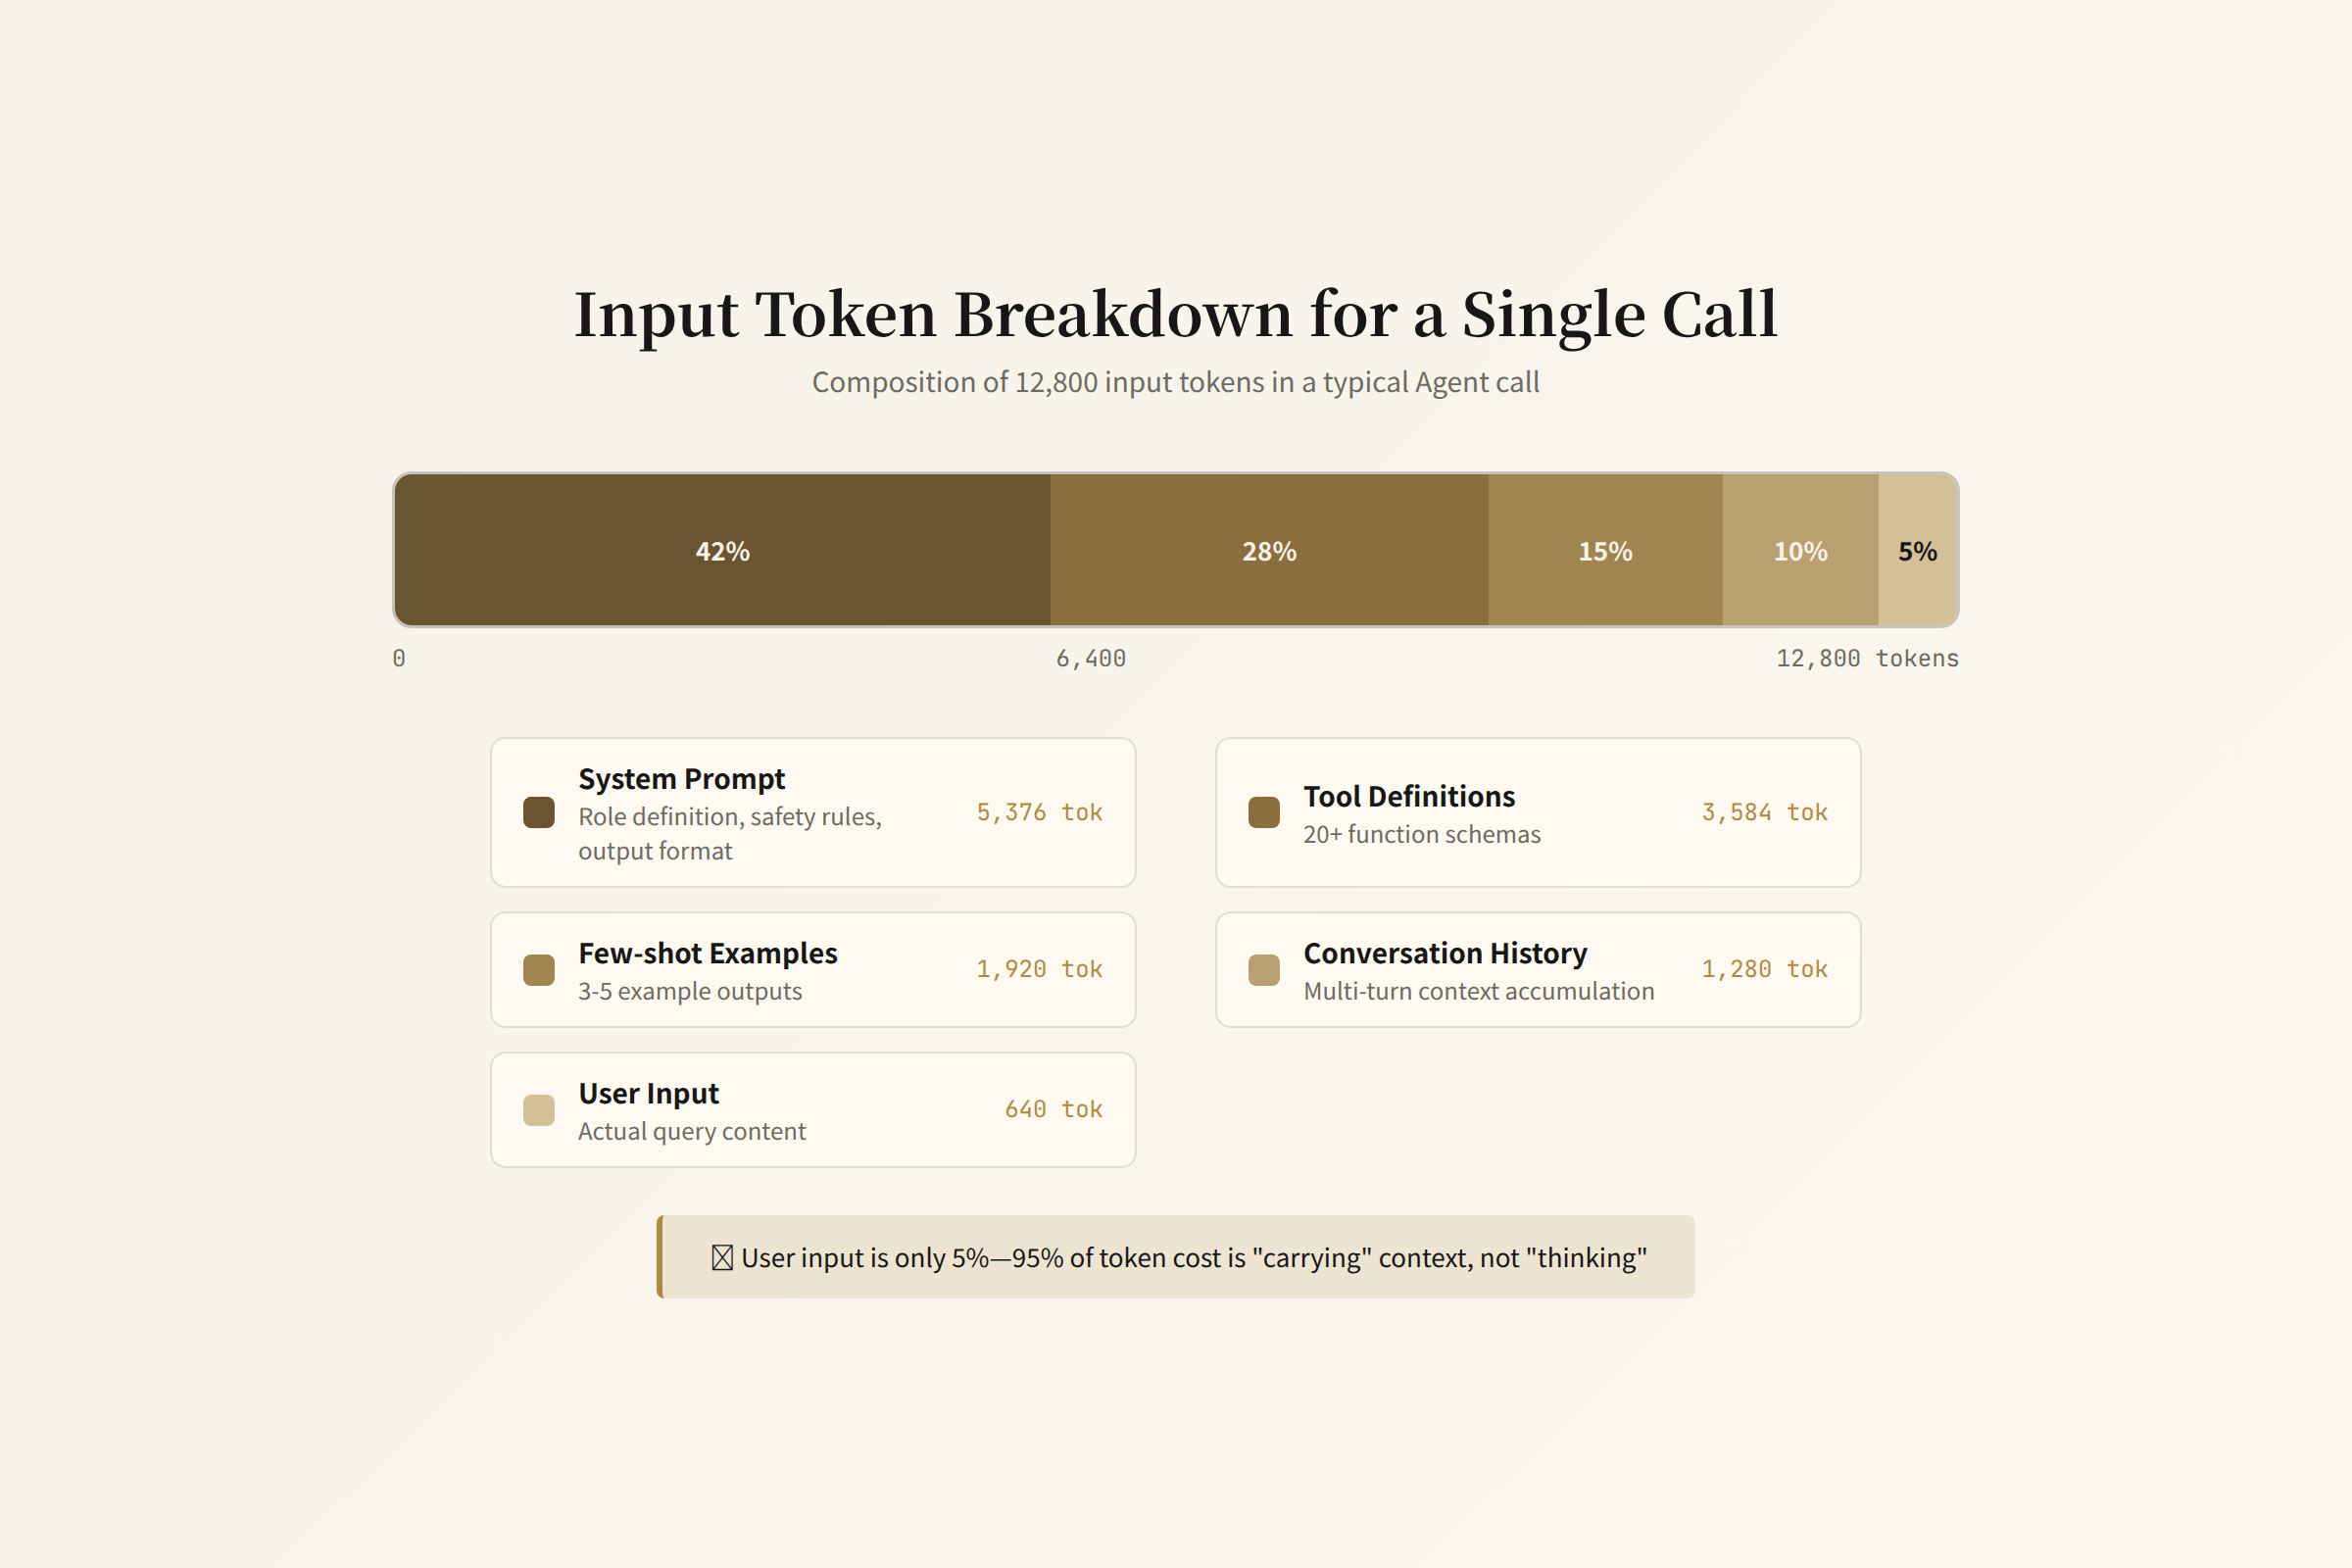
Breaking down a month of API calls by token type:
| Token Category | % of Input Tokens | Purpose | Required Every Call? |
|---|---|---|---|
| System Prompt | 42% | Defines Agent role, behavior, output format | ✅ Identical every call |
| Tool Definitions (Tool/MCP Schema) | 28% | Describes available tools' parameters and return formats | ✅ Mostly identical |
| Few-shot Examples | 15% | Shows the model expected output format | ⚠️ Cacheable or compressible |
| History Steps | 10% | Previous reasoning steps and tool returns | ⚠️ Truncatable or summarizable |
| Actual User Input | 5% | What the user actually asked | ✅ Core value |
The table above is based on empirical distributions from typical Coding Agent workloads [1]. Ratios vary across Agent architectures.
In other words, 95% of input tokens are "infrastructure" — nearly identical content re-sent on every API call. This is why prompt caching became a standard feature across all major inference engines in 2025–2026: if the system prompt + tool definitions are the same every time, why not let the model remember them?
But prompt caching only solves part of the problem. The deeper issues are below.
The Hidden Cost of Prompts
An Agent's system prompt typically looks something like this:
You are a data analysis assistant. Your responsibilities are:
1. Understand the user's data analysis needs
2. Select appropriate tools to retrieve data
3. Analyze and visualize the data
4. Generate clear reports

## Available Tools

### web_search
Description: Search the internet for the latest information
Parameters:
  - query (string, required): Search keywords
  - max_results (int, optional): Maximum results, default 10

### read_file
Description: Read local file contents
Parameters:
  - path (string, required): File path
  - encoding (string, optional): Encoding format, default utf-8

### execute_sql
Description: Execute a SQL query
Parameters:
  - query (string, required): SQL statement
  - database (string, optional): Database name, default main
  - timeout (int, optional): Timeout in seconds, default 30

### generate_chart
Description: Generate data visualization charts
Parameters:
  - data (array, required): Data points
  - chart_type (string, optional): Chart type, default bar
  - title (string, optional): Chart title

[... more tools ...]

## Output Specifications

- Present analysis results in markdown tables
- Round numbers to two decimal places
- Use warm color palettes for charts
- Conclusions section should not exceed 200 words

## Notes

- Do not execute unconfirmed write operations
- Auto-truncate SQL query results exceeding 1000 rows
- Mask sensitive data (phone numbers, ID numbers)
This prompt is roughly 1,500 tokens. Add 8 tool schema definitions (~200 tokens each), and the total input is about 3,100 tokens. That seems small — but every API call sends the full payload.
If an Agent runs a 15-step task, each step carrying the full system prompt + tool definitions + history:
Step 1:  3,100 (prompt) + 200 (user input) = 3,300 input tokens
Step 2:  3,100 (prompt) + 3,300 (history) + 200 (new input) = 6,600 input tokens
Step 3:  3,100 + 6,600 + 200 = 9,900 input tokens
...
Step 15: 3,100 + 45,800 + 200 = 49,100 input tokens

15-step total: ~400,000 input tokens
Of which system prompt + tool definitions re-sent: 3,100 × 15 = 46,500 tokens (12%)
History accumulation: ~340,000 tokens (85%)
Actual user input: ~200 × 15 = 3,000 tokens (0.75%)
In a 15-step Agent task, the user's actual contribution is less than 1% of total tokens. The remaining 99% is structural infrastructure cost.
This is why prompt caching matters — if the system prompt + tool definitions can be cached, those 46,500 tokens don't need to be recomputed each time. But the accumulating history bloat is a harder problem to crack.
The Marginal Cost of Context Windows
Why is the price jump from 4K to 32K context relatively moderate, but from 128K to 1M exponential?
It's not providers gouging customers. The cost increase stems from the mathematical nature of Attention computation.
Transformer Self-Attention requires every token in the sequence to compute attention scores with every other token. For a sequence of length $n$:
Attention matrix size: n × n
Computational complexity: O(n²·d), where d is head dimension
KV Cache size: O(n·L·H·d), where L is layers, H is heads
Take a model with 128 layers, 128 heads, head dimension 128:
| Context Length | KV Cache Size | Attention Computation | Relative Cost |
|---|---|---|---|
| 4K | 4 GB | 16M | 1x |
| 32K | 32 GB | 1B | 64x |
| 128K | 128 GB | 16B | 1,000x |
| 1M | 1 TB | 1T | 65,000x |
From 4K to 1M, computation grows 65,000x. Reality is even harsher: when context expands from 4K to 128K, inference throughput drops roughly 50x. Chroma's Context Rot study (2025.07, testing 18 models) found that accuracy begins degrading beyond 32,000 tokens — even on simple word repetition tasks. But API pricing can't increase 65,000x — so providers subsidize long-context requests with profits from short-context ones.
This means long-context requests are "subsidized" in pricing. Once providers start pricing by actual cost (a trend already underway), running Agent tasks at 1M context will force an architecture rethink.
Flash Attention mitigates part of the problem — through tiling and recomputation, it reduces HBM access from O(n²) to O(n²/M), where M is SRAM size. But this only delays the inflection point of exponential growth; it doesn't change the trajectory.
The MoE Pricing Paradox
Mixture of Experts models break the simple linear pricing relationship.
A dense model (like GPT-4o) activates all parameters per inference. The pricing logic is intuitive: more parameters → more computation → higher price.
MoE models activate only a small subset of experts per inference. Here are the activation ratios of mainstream MoE models:
| Model | Total Params | Active Params | Activation Ratio | Input Price/MTok |
|---|---|---|---|---|
| DeepSeek V3 | 671B | 37B | 5.5% | ¥2.00 |
| GLM-4.5 | 355B | 32B | 9.0% | ¥0.80 |
| GLM-5.2 | 744B | ~40B | 5.4% | ¥8.00 |
| Mixtral 8×7B | 46.7B | 12.9B | 27.6% | Provider-dependent |
Over 90% of parameters are "asleep" during each inference — but they still occupy VRAM. DeepSeek V3's activation ratio is only 5.5%, meaning 94.5% of parameters are completely inert but still consume HBM capacity.
This creates a pricing dilemma:
- Price by total parameters (traditional logic): DeepSeek V4 has 400B parameters, should be priced like a 400B dense model
- Price by activated parameters (DeepSeek's choice): Only charge for 40B worth of computation, pricing at 1/10 of a 400B model
- Price by VRAM footprint (provider's actual cost): Whether activated or not, 400B of weights must sit in VRAM — the memory cost is fixed
DeepSeek chose to price by activated parameters — DeepSeek V4 Pro is priced at ¥3/M input (~$0.41), ¥6/M output (~$0.82). Compared to GPT-4o at $2.50/$10.00 and Claude Opus 4.7 at $5.00/$25.00, the input price gap is roughly 6–12x. Daily token calls in the Chinese market grew from 100 billion to 140 trillion (a thousand-fold increase in two years), driven largely by the commoditization effect of MoE pricing.
This pricing strategy is reshaping the market. The FT reported enterprises tightening AI usage, Cisco publicly admitting AI budget overruns, and Microsoft evaluating self-hosting DeepSeek — all direct consequences of this pricing gap.
But MoE pricing carries a hidden risk: VRAM costs don't decrease just because only 10% of parameters are activated. 400B of weights still requires ~800GB of VRAM (FP16), equivalent to 10 H100s. The provider's hardware investment hasn't decreased — only the computation cost has. If MoE model pricing continues to drop, provider margins will be squeezed unless inference efficiency optimizations (KV Cache sharing, expert offloading, quantization) can close the gap.
The Economics of Model Routing
Model routing — sending simple requests to cheap models and complex requests to flagships — is standard practice for enterprise cost reduction. RouteLLM (LMSYS, 2024, arXiv:2410.02062) provides the most authoritative numbers: a GPT-4 + Mixtral 8x7B combo reduces cost by 85% on MT-Bench while reaching 95% of GPT-4's performance. AgentConductor (SJTU, 2026, arXiv:2602.17100) achieved 68% token savings in multi-Agent orchestration with accuracy actually improving by 14.6%. But model routing has its own hidden costs.
The economics of routing accuracy: If the router mistakenly sends a complex request to a cheap model, the cheap model's output isn't good enough, requiring a retry — with the flagship model. The total cost for that request = cheap model fee + flagship model fee + extra latency. If misrouting exceeds 20%, "saving money" becomes "burning money."
OpenRouter Fusion real-world data (2026.06, OpenRouter official announcement): A budget combo (Gemini 3 Flash + Kimi K2.6 + DeepSeek V4 Pro) scored 64.7% on the DRACO benchmark, surpassing GPT-5.5 solo (60.0%) and Opus 4.8 solo (58.8%), at roughly 50% of Fable 5 solo cost. But Fusion's default 3-model parallel per-call cost is 4–5x that of a single model — it only makes sense when fusion quality significantly exceeds flagship solo performance.
The router's own token cost: The router is itself an LLM call. It needs to read the user request, judge complexity, and select a model. If the router uses 500 tokens to make its decision and the user request itself is only 50 tokens, the router's cost is 10x the request. For short requests, routing overhead can exceed what it saves.
The real cost savings from model routing come from a simpler insight: most enterprise AI requests are "simple" — text summarization, format conversion, basic Q&A. These don't need GPT-5.5-level capability. Routing them to glm-4.5-air or DeepSeek Flash produces quality differences users can't perceive, at a fraction of the cost.
But "most" doesn't mean "all." The key is knowing which requests belong to the "most" and which are the minority needing flagship. This brings us back to observability — without token-level cost tracking and cost breakdown by request type, the savings from model routing are blind guesses.
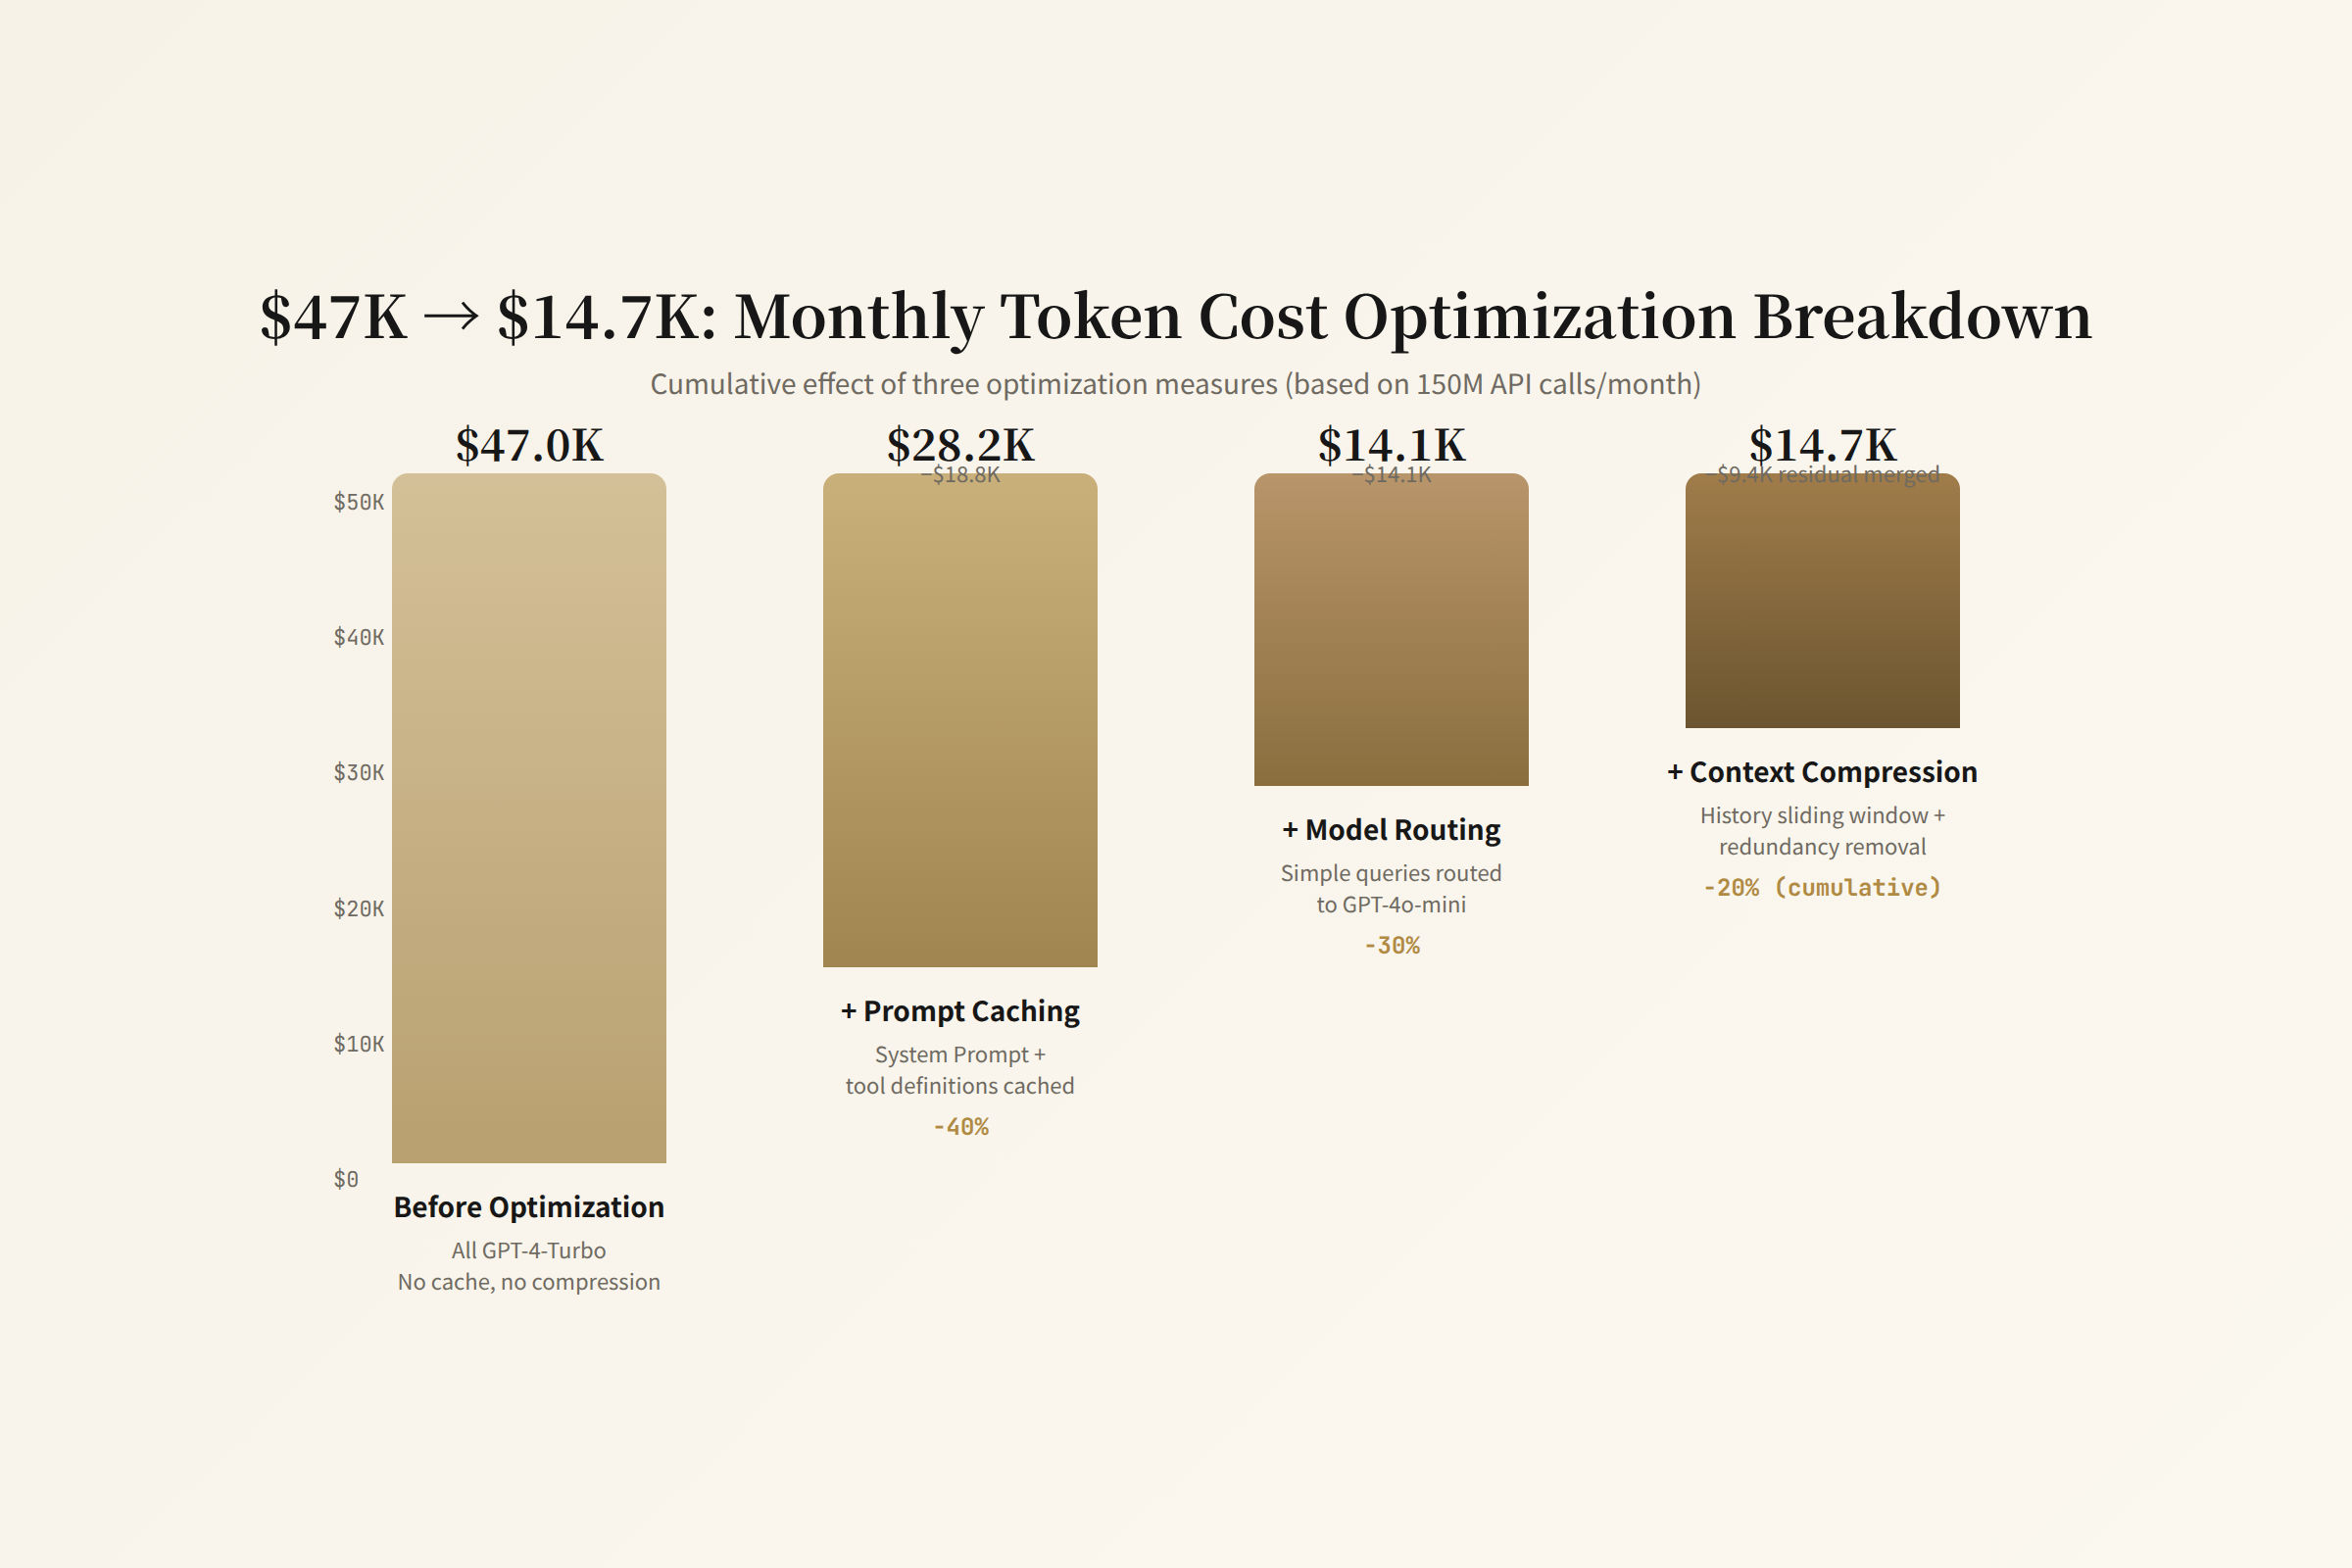
From $47K to $14K: An Enterprise Playbook
Back to that $47,000 bill. Three optimizations were applied:
1. Prompt Caching (saves $18,800/month, 40%)
System prompts and tool definitions are identical across all calls. With prompt caching enabled, these tokens go from "recomputed every time" to "computed once then cached." Anthropic's prompt caching applies a 90% discount to cached portions; OpenAI has similar mechanisms.
Result: input token costs drop 40%.
2. Model Routing (saves $14,100/month, 30%)
Requests split into three tiers:
- Simple (format conversion, basic Q&A) → GLM-4.5-Air, ¥0.80/M (~$0.11)
- Medium (code completion, document search) → DeepSeek V4 Flash, ¥3/M (~$0.41)
- Complex (multi-step reasoning, creative generation) → keep GPT-4o, $2.50/M
70% of requests routed to the first two tiers. Misrouting rate kept under 5% (benchmarked against labeled data).
3. Context Compression + History Truncation (saves $9,400/month, 20%)
For Agent history exceeding 10 steps, keep only the most recent 5 steps + a summary of the first step. Tool returns exceeding 2,000 tokens get auto-summarized to 500 tokens.
Result: average input tokens per call dropped from 45K to 18K.
Total: $47,000 → $14,700. A 69% reduction.
But without the third layer of observability — token-level cost tracking — these optimizations can't be validated. All you see is "the monthly bill went from $47K to $15K." Which optimization contributed how much? Which request types cost the most? Did any optimization reduce quality? These questions are unanswerable without token-level data.
Token & API Observability: From Bill to Attribution
The three optimizations above (caching, routing, context compression) can only be validated and maintained with a sufficiently granular observability system — one that tells you where every API call's tokens went and whose money was spent. This section breaks down the observability stack: four drill-down levels, six key observation points, a concrete instrumentation plan, and how it connects to the rest of this series.
Four Drill-Down Levels: From Single Call to Organization-Wide
Token cost observability isn't a single granularity. Different roles care about different levels:
| Level | Observation Target | Typical Question | Primary Audience |
|---|---|---|---|
| Request-level | Token composition of a single API call | Why did this call cost $0.03? | Engineers |
| Session-level | Cumulative consumption of a user session | How much did one user's conversation cost? | Product Managers |
| Task-level | End-to-end cost of one Agent task | What's the ROI of this 15-step task? | Agent Architects |
| Monthly-level | Organization-wide AI spend breakdown | Which departments/apps/models are burning money? | CTO / CFO |
These four levels aren't independent dashboards — they form a drillable chain. Monthly report flags an anomaly → drill into a specific app → drill into a task type → drill into sessions → ultimately pinpoint the token composition issue in specific API calls. If any link in this chain is broken, attribution stalls at "we spent a lot this month."
Six Key Observation Points × Metrics × Tools
① Prompt Composition Tracking
What to observe: Break down each API call's input tokens by source — system prompt, tool schema, conversation history, few-shot examples, actual user input.
Key metrics:
input_token_breakdown_ratio: Percentage of each component in total input tokensprompt_template_drift: Token count change over time for the same template (detects silent prompt modifications)
Tools: Langfuse prompt tracking, custom API middleware. Langfuse's generations table automatically records prompt content and token counts, enabling per-template aggregation.
Instrumentation point: API client wrapper layer. Before sending the request, use a tokenizer (e.g., tiktoken for OpenAI / transformers tokenizer for others) to decompose prompt sections and write them as span attributes.
② Prompt Caching Hit Rate
What to observe: Did the prompt cache hit? How much was cached? Why did misses occur?
Key metrics:
cache_hit_rate:cached_tokens / total_input_tokens, bucketed by prompt templatecache_miss_reason: Template change / prefix mismatch / cache expiry / exceeded cache windowcache_savings_ratio: Savings from caching as a percentage of original cost
Tools: Parse API response usage fields directly — Anthropic returns usage.cache_read_input_tokens and usage.cache_creation_input_tokens; OpenAI returns usage.prompt_tokens_details.cached_tokens. Langfuse can auto-correlate these fields with cost calculations. Arize Phoenix's LLM tracing also provides caching metric dashboards.
Instrumentation point: API response parsing layer. Extract caching-related fields immediately after response, compute hit rate, and write to trace span.
③ Model Routing Decision Tracking
What to observe: Why did the router choose this model? How accurate is routing? What's the retry cost from misrouting?
Key metrics:
routing_accuracy: Agreement between routing decisions and labeled benchmarksmisrouting_rate: Percentage of requests routed to the wrong tierretry_cost_from_misrouting: Extra cost from retries caused by misroutingrouter_overhead_ratio: Router's own token consumption as a fraction of request tokens
Tools: RouteLLM has built-in decision logging (recording per-request features, selected model, confidence score); custom routers should write structured logs at decision points (JSON format: request_features, selected_model, confidence_score, routing_reason). Langfuse's metadata field can carry routing decision context.
Instrumentation point: Router decision function. Before route(request) -> model returns, log the request feature vector, candidate model list, selection result, and confidence score.
④ Cost Attribution by App / Department / User
What to observe: Which app is burning money? Which user has anomalous token consumption? Which task type has the highest unit cost?
Key metrics:
cost_per_app: Daily/weekly/monthly cost aggregated by application_idcost_per_user: Cost aggregated by user_id, paired with z-score or IQR for anomaly detectioncost_per_task_type: Cost aggregated by task_type (e.g., "code completion" vs "document search" vs "data analysis")cost_trend_slope: 7-day moving average slope of cost across dimensions, detecting sudden spikes
Tools: API gateway logs (Kong / APISIX / custom proxy) + billing system. Langfuse's cost tracking supports custom dimension aggregation by session, user, metadata. Helicone as an OpenAI proxy provides built-in per-user / per-tag cost stats. Cloudflare AI Gateway offers per-endpoint cost breakdown.
Instrumentation point: Inject attribution tags into API request headers. Follow OpenInference semantic conventions:
llm.application_id: Application identifierenduser.id: User identifierllm.task_id/ customtask_type: Task identifier
These headers are extracted at the proxy layer and written into trace context, threading through the entire observability chain.
⑤ Token Efficiency Ratio
What to observe: Of all tokens consumed, how many are creating actual value?
Key metric:
token_efficiency_ratio= (actual user input tokens + model output tokens) / total tokens
Typical values range from 5%–20%. Below 5% means over 95% of token consumption is structural overhead — common in Agent tasks (as shown in earlier calculations), but a persistently declining ratio signals prompt bloat or history truncation failure.
Tools: Custom analysis scripts. Tag each token segment by type (system / tool / history / user / output) at the API client wrapper layer, then aggregate by time window. Langfuse's custom dimensions can store token type labels.
Instrumentation point: API client wrapper layer, reusing the same token decomposition logic from observation point ①.
⑥ API Health
What to observe: LLM API latency distribution, error rates, retry behavior. This is the foundational dependency for cost observability — a 500 error followed by retry means double token consumption.
Key metrics:
api_latency_p50 / p95 / p99: Latency distribution bucketed by model and endpointerror_rate: Error rate by status code (focus on 429 rate limits and 500 server errors)retry_count: Average retries per requestfallback_rate: Percentage of requests triggering model fallbackrate_limit_utilization: Current RPM / TPM as a percentage of quota
Tools: API gateway (Kong / APISIX) standard metrics + Prometheus + Grafana dashboards. OpenTelemetry's HTTP semantic conventions can standardize LLM API traces/metrics. Datadog LLM Observability or New Relic AI Monitoring provide out-of-the-box API health panels.
Instrumentation point: API proxy layer standard HTTP metrics (latency, status code, request size). The proxy layer is the ideal unified instrumentation point — regardless of how many upstream apps call the LLM, all requests pass through the proxy.
Instrumentation Plan: API Client Wrapper Layer
The six observation points don't require scattered instrumentation. They can converge into a single API client wrapper layer — the choke point for all LLM calls. Here's a production-ready instrumentation plan:
import tiktoken
from opentelemetry import trace

tracer = trace.get_tracer("llm.observability")

def count_tokens(messages: list[dict], model: str) -> dict:
    """Decompose token sources, return per-component token counts."""
    enc = tiktoken.encoding_for_model(model)
    breakdown = {"system": 0, "tools": 0, "history": 0, "user": 0}
    for msg in messages:
        role = msg.get("role", "user")
        tokens = len(enc.encode(msg.get("content", "")))
        if role == "system":
            breakdown["system"] += tokens
        elif role == "tool":
            breakdown["tools"] += tokens
        elif role in ("assistant", "function"):
            breakdown["history"] += tokens
        else:
            breakdown["user"] += tokens
    breakdown["total_input"] = sum(breakdown.values())
    return breakdown

async def traced_llm_call(request: LLMRequest) -> LLMResponse:
    """Observable wrapper for all LLM calls."""
    with tracer.start_as_current_span("llm.call") as span:
        # ━━ Pre-request: Token composition analysis (observation point ①)
        token_breakdown = count_tokens(request.messages, request.model)
        span.set_attribute("llm.token_count.system",     token_breakdown["system"])
        span.set_attribute("llm.token_count.tools",       token_breakdown["tools"])
        span.set_attribute("llm.token_count.history",     token_breakdown["history"])
        span.set_attribute("llm.token_count.user",        token_breakdown["user"])
        span.set_attribute("llm.token_count.total_input", token_breakdown["total_input"])

        # ━━ Attribution tags (observation point ④)
        span.set_attribute("llm.application_id", request.app_id)
        span.set_attribute("enduser.id",         request.user_id)
        span.set_attribute("llm.task_id",        request.task_id)
        span.set_attribute("llm.task_type",      request.task_type)
        span.set_attribute("llm.model",          request.model)

        # ━━ Routing decision context (observation point ③)
        if hasattr(request, "routing_meta"):
            span.set_attribute("llm.routing.confidence",   request.routing_meta.confidence)
            span.set_attribute("llm.routing.alternatives", str(request.routing_meta.candidates))

        # ━━ Call API
        response = await llm_client.call(request)

        # ━━ Post-response: Cost & caching (observation points ② ⑤ ⑥)
        span.set_attribute("llm.token_count.output",       response.usage.output_tokens)
        span.set_attribute("llm.cached_tokens",            response.usage.get("cached_tokens", 0))
        cache_hit_rate = (
            response.usage.get("cached_tokens", 0)
            / max(token_breakdown["total_input"], 1)
        )
        span.set_attribute("llm.cache_hit_rate",   cache_hit_rate)
        span.set_attribute("llm.cost",             calculate_cost(request.model, response.usage))
        span.set_attribute("llm.latency_ms",       response.latency_ms)
        span.set_attribute("llm.status_code",      response.status_code)

        # Token efficiency ratio (observation point ⑤)
        value_tokens = token_breakdown["user"] + response.usage.output_tokens
        total_tokens = token_breakdown["total_input"] + response.usage.output_tokens
        span.set_attribute("llm.token_efficiency_ratio", value_tokens / max(total_tokens, 1))

        return response
The elegance of this plan isn't the code itself, but that six observation points share a single span — recording token composition and attribution tags before the request, cost and caching metrics after. One API call produces one complete trace, and downstream analysis systems (Langfuse / Grafana / Datadog) aggregate by different dimensions to produce all four levels of reports.
Connection to Subsequent Articles in This Series
This observability system isn't isolated. Its outputs feed directly into DD2 and DD3:
-
Token consumption anomalies bucketed by model → Trigger DD2 (Inference Engine) deep profiling. If a model's
cost_per_task_typesuddenly triples, tokens didn't get more expensive — more likely, prefill-stage KV Cache hit rates dropped, or decode-stage batch efficiency degraded. Token observability provides the "symptom"; inference engine profiling provides the "diagnosis." -
Cost efficiency decline by task type → Trigger DD3 (Agent Decisions) drift detection. If a "data query" task's average token consumption jumps from 5K to 20K, the most likely cause is the Agent looping on tool calls, stuffing each step's return into context. The slope change in
cost_per_task_typeis the earliest warning signal — detectable before Agent output quality degrades. -
Prompt composition ratio shifts → Direct prompt engineering optimization.
input_token_breakdown_ratioshifting from system:42% to system:60% means someone piled new rules into the system prompt.historyclimbing from 10% to 40% means context truncation policy failed or was bypassed. These changes are immediately visible at the token level.
A complete attribution chain looks like this:
Monthly report: GPT-5.5 cost up 27% MoM
  → Drill into app: code-assistant accounts for 80% of the increase
    → Drill into task type: multi-file-refactor avg cost from $0.08 → $0.15
      → Drill into sessions: Agent steps increased from 12 to 28
        → Drill into requests: history token ratio climbed from 10% to 55%
          → Root cause: 3 new MCP tool definitions added 4,200 tokens/step
            → Fix: Enable prompt caching + lazy-load tool definitions
Without this observability system, all you see is "the AI bill went up." With it, you see "3 new MCP tool definitions doubled the cost of multi-file-refactor tasks; recommend enabling prompt caching and lazy-loading tool definitions." From bill to attribution — that's what this section's title means.
Tool Landscape and Challenges
Current state: Langfuse is the most mature option for token/cost tracking — open source, ClickHouse backend, with per-prompt-template granular cost attribution that has no real competitor. Arize Phoenix has an edge among ML engineers, particularly for embedding analysis and native OpenInference support. OpenInference defines the LLM semantic conventions that serve as the interoperability layer between different tools. Yet most enterprises still rely on API provider monthly bills for cost management — seeing only the total, not the composition.
Challenges:
-
Cross-provider token counting is inconsistent. OpenAI (tiktoken), Anthropic (proprietary tokenizer), and DeepSeek (BBPE tokenizer) each use different tokenizers — the same prompt can vary 15–20% in token count across providers. Cross-provider cost comparison and routing decisions are thus built on inconsistent measurement foundations.
-
Prompt caching cost attribution is complex. Cache hits and misses are priced differently — Anthropic charges 10% for cache reads and 125% for cache writes. But most existing tools don't distinguish the two, recording only an aggregate cost. When caching strategy changes, a "40% cost reduction" may mask the reality that "actual call volume increased 20% — the cache just compensated."
-
Real-time cost alerting is absent. Most tools only do post-hoc analysis — T+1 cost reports, daily trend charts. They can't intervene in real time when token consumption spikes (e.g., an Agent stuck in a loop deadlock burning $5/minute). This means an Agent running unchecked over a lunch break can incinerate a month's budget before anyone notices.
-
Model routing's own decision cost isn't tracked. The router is an extra LLM call — it consumes tokens, adds latency, and can misjudge. But most implementations lump router cost into "system overhead" without separate accounting. For short requests, router cost can be 50%+ of total request cost — a ratio that's never scrutinized.
Requirements for the tooling ecosystem:
- A unified token accounting standard — normalized cross-provider token counting (e.g., defining "standard token = 4 characters") to make cost comparisons meaningful
- Real-time cost streams (streaming cost metrics), not batch-processed T+1 bills — per-second per-request cost event streams supporting threshold-based real-time alerting and automatic circuit breakers
- Multi-dimensional cost attribution by application/user/task — requiring all LLM calls to carry structured attribution tags (like OpenInference's
llm.application_id) with attribution chains that survive across multi-step Agent calls
Three Trends
Trend 1: Token pricing commoditization. DeepSeek's pricing is already 1/20–1/30 of OpenAI's. Once inference optimization technologies (spec decoding + KV Cache sharing + 2-bit quantization) mature, marginal inference cost will approach the physical floor of electricity + depreciation. The pricing premium for frontier models can only come from "exclusive capabilities" — once capabilities are replicated, pricing collapses.
Trend 2: From "pay per token" to "pay per outcome." When token cost is low enough and Agent capability strong enough, users stop caring about token counts — they care about "did this task get done?" API billing is evolving from per-token to per-task / per-outcome. Anthropic's Programmatic Tool Calling (PTC) demonstrated an extreme case: letting an Agent orchestrate tools via code rather than sequential API calls, reducing token consumption from 150K to 2K — a 98.7% reduction. FutureAGI's analysis is more direct: in a representative workload of 12 engineers / 8 MCP servers / 22 sessions per day, MCP protocol overhead (tool definitions + response serialization) accounts for 41–58% of total token spend [2] — for every $1 spent on model inference, roughly $0.50 goes to protocol overhead.
Trend 3: Cost observability becomes AI platform infrastructure. Langfuse's token/cost tracking, OpenInference's semantic conventions, every AI cloud's cost dashboard — these aren't "nice to have," they're "must have." An AI platform without cost observability is like a cloud service without a billing system.
References
[1] Token distribution ratios are synthesized from FutureAGI's MCP analysis and multiple Coding Agent trajectory studies (e.g., OpenHands/SWE-bench analysis arXiv:2604.22750). Distributions vary significantly across Agent frameworks and task types.
[2] FutureAGI, MCP Token Overhead Analysis.
[3] OpenRouter, "Fusion: Compound Intelligence API", 2026.06. See OpenRouter official announcement. DRACO benchmark data from OpenRouter's official testing; Fable 5 completed 93/100 tasks due to content filtering.
The next Deep Dive opens the inference engine black box: from prefill/decode asymmetry to CUDA kernel-level profiling, showing what's really happening on the GPU behind that "200 OK."