
Google Cloud revenue grew 82% year-over-year. Alphabet's total revenue grew 24% to $119.8 billion. Then free cash flow turned negative $5.9 billion. This is the first quarterly cash burn since Alphabet's IPO.
Revenue is surging. Cash is burning. Both facts hold simultaneously for one reason: AI infrastructure capex (Capital Expenditure) is growing faster than Alphabet's cash generation capacity. The more critical question is how quickly these investments can translate into revenue.
Q2 2026: A Contradictory Scorecard
On July 22, 2026, Alphabet released its Q2 earnings. The numbers are a lesson in AI economics.
The revenue side beat expectations across the board.
| Metric | Q2 2026 | YoY Growth | Market Expectation |
|---|---|---|---|
| Total revenue | $119.8B | +24% | $116.9B |
| Google Cloud | $24.8B | +82% | — |
| Google Services | $94.5B | +15% | — |
| YouTube ads | $11.06B | +13% | $10.8B |
| Search revenue | — | +17% | — |
Google Cloud's 82% growth is accelerating, with an annualized revenue run rate approaching $100 billion. Cloud backlog (the total value of signed but not-yet-recognized contracts) grew from approximately $460 billion in Q1 to $514 billion. Nearly 90% of Fortune 100 companies use Gemini Enterprise.
The profit side requires stripping out investment gains. Alphabet's Q2 reported net income was approximately $112 billion, but about $99 billion of that came from fair-value adjustments on investments including Anthropic and SpaceX. This is paper wealth on the balance sheet, not operating results from the AI business. Excluding investment gains, operating profit growth remains strong, but far less dramatic than the headline net income figure suggests. In an article examining AI capex returns, operating profit is more meaningful than reported net income.
The cash side saw a historic reversal.
| Metric | Q2 2026 | Q2 2025 |
|---|---|---|
| Free cash flow | -$5.9B | Positive |
| Capex | $44.92B | ~$22B (+100%) |
| Full-year capex guidance | $195-205B | Previous guidance $180-190B |
Free cash flow turned negative. FT's Ryan McMorrow noted this is the first quarterly cash burn since Alphabet's IPO.
Where Did $5.9 Billion Go
Free cash flow = operating cash flow minus capex. Alphabet's operating cash flow remains positive. The problem is capex: Q2 reached $44.92 billion, doubling year-over-year.
According to CNBC, approximately 60% of this spending went to servers (GPUs and TPUs), and 40% to data center buildings and networking equipment. At the full-year capex guidance of $200 billion, that means roughly $120 billion in annual procurement of server chips and related hardware. Google is simultaneously one of NVIDIA's largest global customers and the largest buyer of its own TPU (Tensor Processing Unit, Google's in-house AI accelerator chip).
Pichai confirmed on the earnings call that Google is executing "the most ambitious pre-training run in history" for Gemini 4. Enormous compute demand is consuming cash.
$514B Backlog: Demand Is Not the Problem, Supply Is
Google Cloud's contract backlog reached $514 billion. This figure exceeds Alphabet's entire annual revenue and surpasses three years of Cloud revenue at the current run rate.
But backlog is a multi-year cumulative commitment. $514 billion does not represent next year's revenue; it represents enterprise customers' long-term confidence in Google Cloud AI infrastructure. The question is not whether demand is sufficient, but how quickly Google can build data centers, install chips, and convert these contracts into revenue. Pichai was explicit on the call: "supply constrained."
Alphabet's full-year capex guidance was raised from Q1's $180-190 billion to $195-205 billion. For context:
- 2024 full-year capex: approximately $52 billion
- 2025 full-year: approximately $75 billion
- 2026 guidance: $195-205 billion
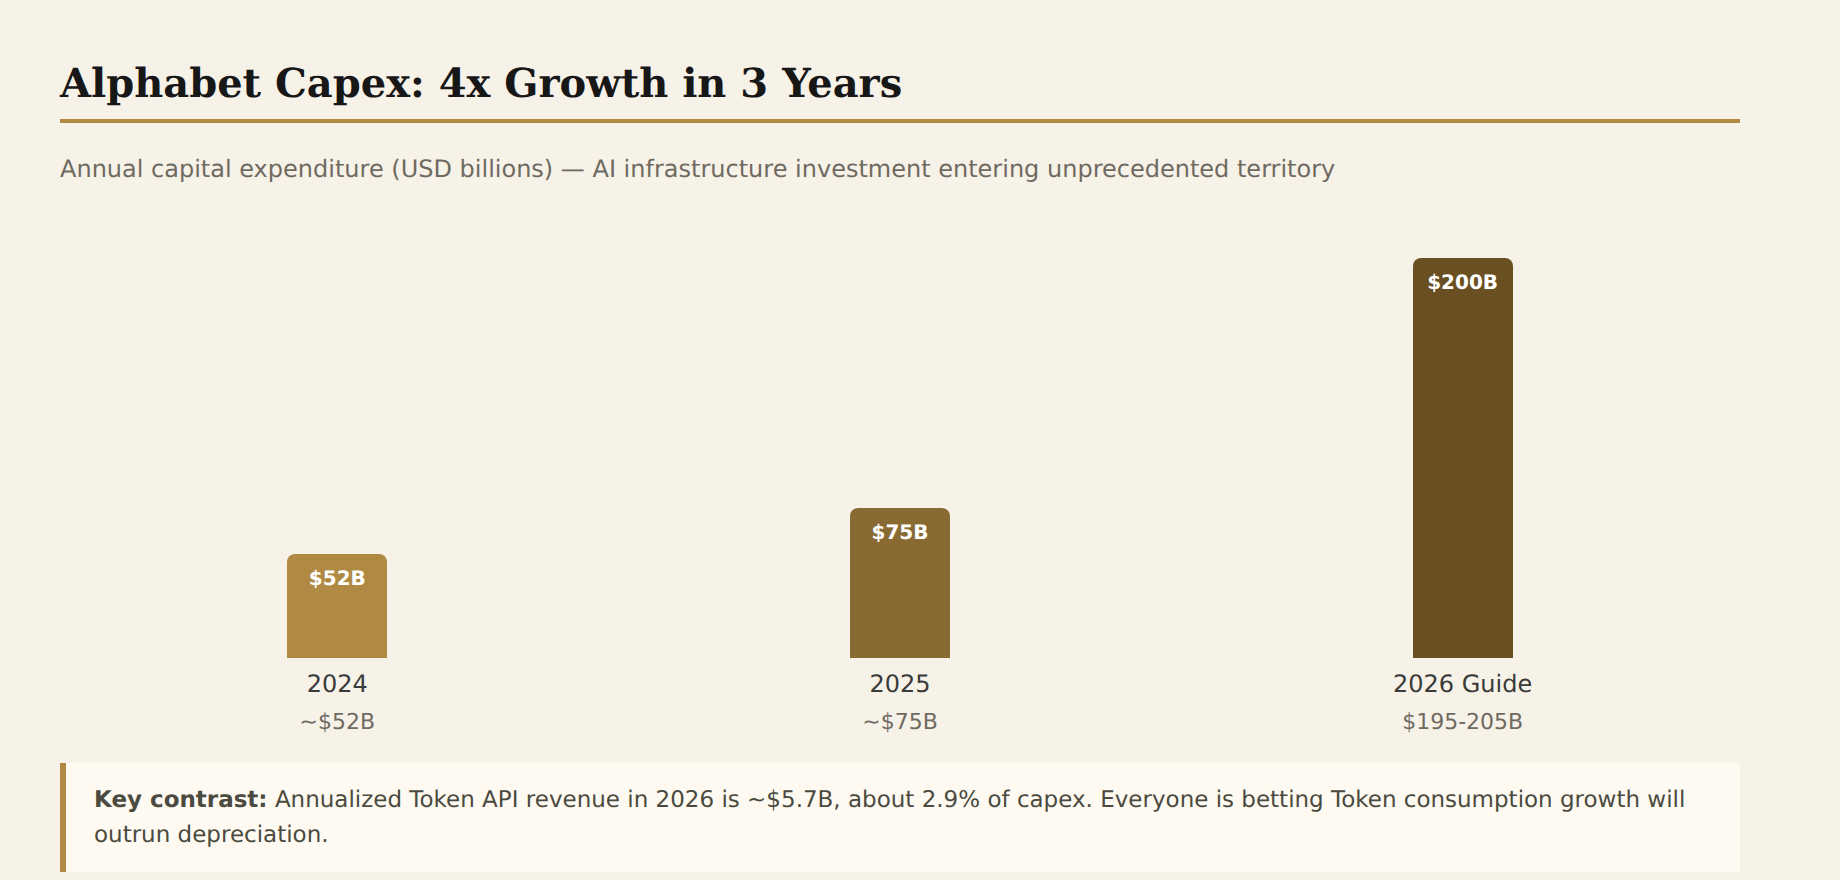
In three years, annual capex has grown nearly 4x.
The Hyperscaler Capex Arms Race
Alphabet is not the only one burning cash. Hyperscalers are collectively pouring massive capital into AI infrastructure:
| Company | Recent Quarterly Capex | Trend |
|---|---|---|
| Alphabet | $44.9B (Q2 2026) | Full-year guidance $195-205B |
| Microsoft | ~$45-50B/quarter (FY2026) | Capex has surpassed Alphabet's |
| Meta | ~$30-35B/quarter | 2026 guidance significantly raised |
| Amazon | ~$30-40B/quarter | Near historic highs |
| Oracle | ~$10-15B/quarter | Large-scale debt-funded buildout |
(Meta, Amazon, and Oracle figures are estimated ranges based on public reporting; precise numbers will come with their next earnings reports.)
When the world's top five tech companies collectively spend over $150 billion per quarter on capex, the scale of AI infrastructure investment has entered territory with no historical precedent. For comparison, the global telecommunications industry's total annual investment during the 1999-2001 fiber optic buildout peak was approximately $200-250 billion. The difference: demand during the telecom bubble was ultimately proven illusory, while AI token consumption is genuinely growing.
The Token Economy: Revenue Validation Is Still Far From Enough
Pichai provided key data on token scale:
- Model APIs process approximately 22 billion tokens per minute, up from 16 billion a quarter ago
- Nearly 500 Cloud customers each processed over 1 trillion tokens in the past 12 months
- Over 2,000 enterprises consumed over 100 billion tokens
- Gemini App has 950 million monthly active users
- 9 million developers are building on Google's platform
22 billion tokens per minute implies a monthly processing volume of approximately 9.6 trillion tokens. At a rough average pricing of $0.5 per million tokens, that yields monthly revenue of approximately $480 million, or an annualized run rate of about $5.7 billion.
$5.7 billion in annualized token revenue versus $200 billion in annualized capex is a ratio of approximately 2.9%.
Of course, token pricing varies enormously depending on model, context length, and whether multimodal capabilities are involved (Gemini Pro output token pricing can reach $5-10 per million tokens), so the actual average price per paid token may exceed $0.5. However, the 22 billion tokens per minute figure includes free-tier usage and Gemini App calls, meaning the actual paid ratio is lower than the total volume. Overall, token API revenue currently accounts for roughly 5-6% of Cloud revenue. It is a fraction of Cloud revenue, not a pillar.
This is the real tension: Alphabet spends $200 billion per year building AI infrastructure, but the token economy's annual revenue is currently in the tens of billions of dollars at best.
The Race Against Depreciation
Capex flows out as a single lump on the cash flow statement, but on the income statement it is amortized over multiple years in the form of depreciation.
CNBC's capex breakdown (60% servers / 40% data centers and networking) helps estimate depreciation pressure more precisely. Using 2026 capex of $200 billion as an example:
- 60% servers = $120 billion, depreciated over 4 years, adds $30 billion in annual depreciation
- 40% data centers + networking = $80 billion, depreciated over a 10-year weighted average, adds $8 billion annually
- Total annual new depreciation from 2026 capex: approximately $38 billion
Adding the accumulated depreciation from historical capex, Alphabet's annual depreciation expense in 2027-2028 could reach $60-80 billion.
This is the core time pressure of AI infrastructure investment: capex deployed in 2025 and 2026 will begin to hit earnings as depreciation concentrated in 2027 onward. If token economy revenue has not achieved an order-of-magnitude jump by then, profit margins will face systemic pressure.
A historically comparable case is AWS's investment cycle. Amazon's FCF was under sustained pressure during the 2010-2015 AWS buildout period, but Cloud profit margins ultimately far exceeded expectations. Alphabet may follow the same path. The difference: AWS's investment-period capex was in the range of single-digit billions per year. Alphabet is now at $45 billion per quarter. The scale is entirely different.
Signals for the Supply Chain
For GPU/NPU suppliers: Capex guidance raised from $180 billion to $205 billion signals that procurement is accelerating even under supply constraints. Of Google's approximately $120 billion in server procurement, the split between NVIDIA and TPU is not disclosed, but both benefit.
For investors: The AI infrastructure investment cycle is not a one- or two-quarter affair. Until the capex-to-revenue ratio normalizes, the market will persistently question returns. Alphabet's stock declined despite the Q2 beat, indicating investors are already pricing in capex risk. Everyone in this race is betting that demand growth will outrun depreciation. Whether that bet pays off will become clear in 2027-2028.
Conclusion
Alphabet's Q2 signal is clear: the question of AI infrastructure investment returns is not whether they will come, but whether returns can arrive in time.
The depreciation from $200 billion in annualized capex begins to concentrate in 2027, while the token economy's annual revenue currently stands at only ~$5.7 billion. Everyone on the track is betting that demand growth will outrun depreciation. The outcome of this race will be decided in 2027-2028.
If token consumption maintains its current growth rate (~40% quarter-over-quarter), if Gemini Enterprise enterprise penetration continues to deepen, if agent workloads truly explode, these capex investments will prove forward-looking, and depreciation will be covered by higher revenue.
If any one of these assumptions fails to materialize, these investments will become a crushing burden on profit margins. The telecom industry experienced a major shakeout following infrastructure investment of comparable scale. AI demand is more real than the telecom bubble, but the absolute scale is also larger.
A capex floor of $200 billion per year means something else: AI infrastructure is transitioning from technical competition to capital competition. The number of players who can remain at the table is shrinking rapidly. Globally, no more than five companies can sustain this level of capex. This is not an open market; it is a market accelerating toward concentration.
Sources
- Alphabet Q2 2026 Earnings Release (PDF)
- Sundar Pichai Q2 2026 Earnings Call Remarks — Google Blog
- Alphabet Q2 2026 Earnings Slides (PDF)
- FT: Google reports Q2 free cash flow at negative $5.9B
- Bloomberg: Google projects full-year capex $195B-$205B
- CNBC: Alphabet earnings Q2 2026 — capex 60% servers / 40% data centers
- TechCrunch: Google justifies massive AI spending
- The Verge: Gemini now has 950M MAUs
- finbold.com: Google stock wiped $138B despite revenue beat
Not investment advice. Data as of: Alphabet Q2 2026 earnings release, July 22, 2026. Meta/Amazon/Oracle capex figures are estimated ranges based on public reporting.