
On June 30, 2026, SiliconFlow, a 34-month-old company, filed with the Hong Kong Stock Exchange under Chapter 18C for special technology companies. The market calls it the "first AI Token Factory stock." The prospectus lays out the company's full ledger: 2025 revenue of RMB 55.33 million, up 653% year over year, gross margin of -24%, net loss of RMB 345 million, and a valuation of RMB 7.74 billion. Against 2025 revenue, that is roughly 140x price-to-sales.
Revenue grew sevenfold while gross margin went negative and losses widened. Why would the capital market still assign 140x price-to-sales? This analysis starts from the prospectus numbers, takes apart the Token Factory's technical composition, operating metrics, customer structure, and revenue quality, compares two overseas benchmarks (listed CoreWeave and Together AI at $8.3B), and closes with a breakeven sensitivity model.
I. The ledger: what a Token Factory's books look like
SiliconFlow runs a compute-middleman business: it leases heterogeneous compute from upstream (NVIDIA, Huawei Ascend, AMD, MetaX, and others), feeds it through a proprietary inference engine, converts it into standardized tokens, and sells those to developers and enterprises. The prospectus calls it an "open, independent token supply platform."
The revenue mix flipped fundamentally in 2025. In 2024, on-premises deployment accounted for 85.4% of revenue and public cloud only 14.6%. In 2025, public cloud services generated RMB 29.26 million, rising to 52.9% and becoming the largest revenue line for the first time; on-premises deployment brought RMB 26.07 million, 47.1%.
The two businesses have opposite economics. Public cloud posted a -119% gross loss rate in 2025 (-271.6% in 2024): every RMB 1 of revenue required RMB 2.19 of direct cost. On-premises deployment carried an 82.5% gross margin, the company's only source of profit.
The cost structure reveals where the losses come from. Cost of sales reached RMB 68.63 million in 2025, exceeding total revenue by RMB 13.3 million; purchased compute alone was RMB 59.63 million, 86.9% of cost of sales. Sales and marketing spending jumped 1,210% from RMB 6.39 million in 2024 to RMB 83.74 million in 2025, of which free-token vouchers (promotional compute) accounted for RMB 54.21 million, 64.7% of that line. R&D spending was RMB 209 million, 3.78x revenue.
Customer concentration improved, but in a way that deserves scrutiny. The top-five customer share fell from 100% in 2023 to 85% in 2024 and 45% in 2025; the single largest customer dropped from 83.3% to 13.6%. Yet no customer on the top-five list repeated across all three years. Concentration dispersed because no sticky core customer base formed.
The ledger's verdict: this is a trade-scale-for-losses business. Public cloud grabs traffic with below-cost pricing and free vouchers, on-premises earns margin, and R&D keeps burning. Gross margin fell from 83.3% in 2023 (the founding year, when revenue was RMB 6,000, so the denominator was trivial) to 39.4% in 2024 and -24.0% in 2025.
II. Technical composition: heterogeneous orchestration and an inference engine
The Token Factory stack has three layers.
The bottom layer is the inference engine. SiliconFlow's proprietary engine runs models on heterogeneous chips and squeezes out performance. In February 2025 it launched full-strength DeepSeek R1/V3 inference on Huawei Cloud's Ascend, the first production-grade inference on Chinese chips in the industry. Huawei Cloud scrambled over 2,000 Ascend 910B cards at first, adding 1,000 at a time, and ultimately deployed the CloudMatrix 384 supernode (384 cards, optical interconnect, versus NVIDIA's NVL72 with 72 cards and copper).
The middle layer is the compute orchestration system. It pools compute from different vendors and architectures (NVIDIA, Ascend, AMD, MetaX, Moore Threads) into one elastic resource pool and schedules by load. This is the core difference between a Token Factory and an ordinary cloud vendor: no single-chip lock-in, use whoever is cheapest.
The top layer is a unified API. Customers get a standardized interface backed by adapters for more than 170 models (DeepSeek, Qwen, GLM, Llama, and others). They pay per token and never care which chip is underneath.
But the technical moat is being filled in. Alibaba Cloud set up a dedicated Token Foundry business unit led by its group CEO. ByteDance fused Seed-Infrastructure with Volcano Engine. Baidu and Tencent are deepening inference-stack investment. Most critically, chipmakers are starting to bypass the middleman: Moore Threads and MetaX are binding directly with model companies. Cross-chip adaptation is only an entry ticket; the durable advantages sit with the giants, who have their own chips, frameworks, and clusters. An independent middleman's room depends on how long the fragmentation of "many models, many chips" lasts.
III. Operating metrics: token throughput and unit economics
The operating numbers are the most impressive part of this company. Average daily token throughput rose from 47.8 billion in December 2024 to 578.5 billion in April 2026 (roughly 12x in 16 months), with a single-day peak above 1.07 trillion. Registered users grew from 127,000 at the end of 2024 to 10.28 million by April 2026; enterprise customers exceeded 13,000. By annual token throughput in 2025, it ranked fourth among all Chinese token suppliers (the top three were Volcano Engine, Alibaba Cloud, and Baidu AI Cloud, together about 87%) with a 1.5% share, and first among independent ecosystem suppliers.
The unit economics are brutal. In 2025 the company issued RMB 54.21 million of free-token vouchers and generated about RMB 55.33 million of revenue. At the aggregate level, each RMB 1 of vouchers corresponded to roughly RMB 1.02 of revenue (total revenue divided by total vouchers, including non-voucher channels; correlation, not causation). After compute costs, losses were inevitable. Public cloud spent RMB 2.19 of direct cost for every RMB 1 of revenue, a -119% gross loss rate, with compute leasing 86.9% of cost of sales.
The marginal efficiency of subsidies is declining. Users of public cloud shared compute totaled 5.45 million in all of 2025 but only 1.45 million in the first four months of 2026, about a quarter of the prior year's run rate. Registered users grew from 9.197 million at the end of 2025 to 10.28 million by April 2026, only 11.8% in four months. Paid penetration rose from 13.13% to 44.18%, but dedicated-instance customers (the high-value ones) fell from 49 in 2025 to 20 in the first four months of 2026.
Scale is rising; unit economics are not improving. The users subsidies attract are price-sensitive and will go wherever it is cheaper. The high-value customers who actually contribute profit are not growing in step with the user base.
IV. Target customers and revenue analysis: a three-tier structure
SiliconFlow's customers sit in three tiers, each with different economics.
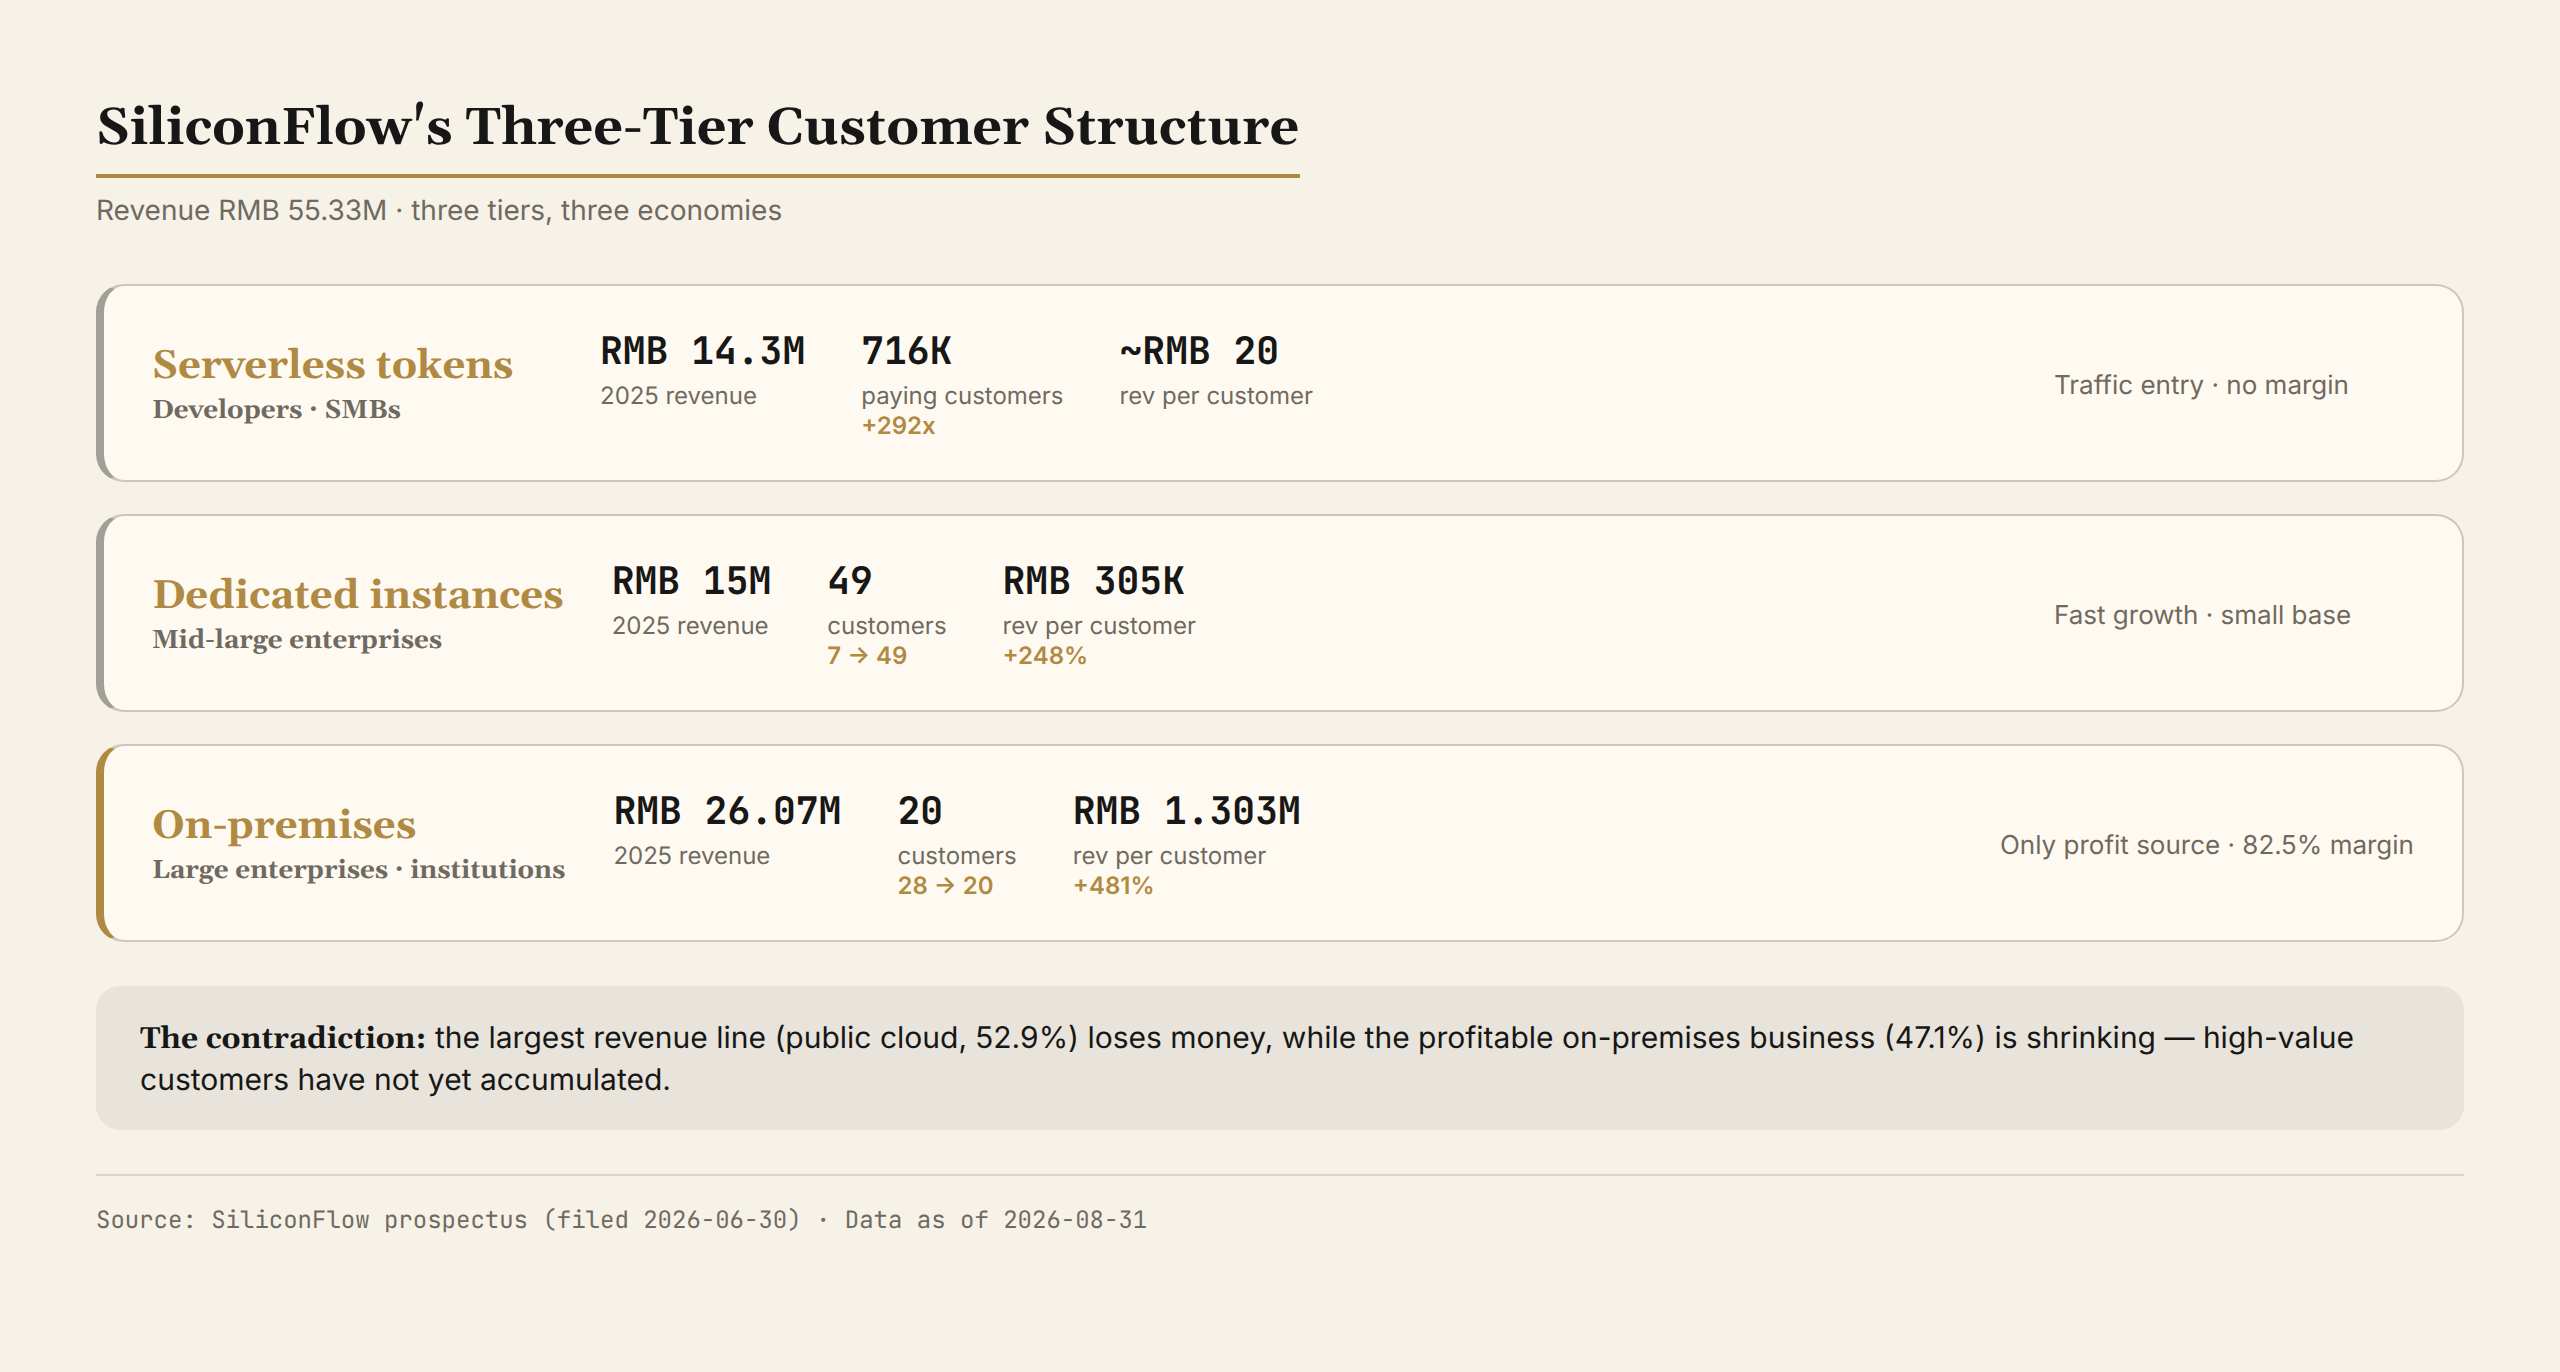
Tier one: serverless token services (individual developers, small customers). Usage-based billing with advance top-ups. 2025 revenue was RMB 14.3 million, and paying customers rose from 2,454 to 716,000 (+292x), contributing about RMB 20 per customer per year. This tier is the traffic entry, educating the market and accumulating developers; it is not meant to make money.
Tier two: dedicated instances (mid-to-large enterprises). Reserved compute plus usage billing. 2025 revenue was about RMB 15 million, customers rose from 7 to 49, and average revenue per customer climbed from RMB 87,700 to RMB 305,000 (+248%). The growth rate is good but the base is small.
Tier three: on-premises deployment (large enterprises and institutions). The inference engine and orchestration system are deployed inside the customer's own data center; revenue is software license, implementation, and maintenance. 2025 revenue was RMB 26.07 million. Customer count fell from 28 to 20, but average revenue per customer jumped from RMB 224,000 to RMB 1.303 million (+481%). Gross margin was 82.5%, the company's only profit source.
The three tiers create a contradiction: the largest revenue line (public cloud, 52.9%) loses money, the second-largest (on-premises, 47.1%) makes money, and the profitable business's customer pool is shrinking (28 to 20 on-premises customers, with only 5 new ones in the first four months of 2026). Overseas monthly revenue passed $1 million in 2026 per the prospectus, but the base is still tiny.
The customers who generate profit are shrinking; the customers who generate losses are expanding. The company's narrative is to accumulate developers on the open platform first, then convert high-value customers into long-term enterprise contracts. The data says that conversion has not happened yet.
V. Overseas benchmarks: the two roads of CoreWeave and Together AI
Two overseas companies typify the two paths a Token Factory can take.
CoreWeave (listed) is the contract-heavy, asset-heavy road. It buys GPUs, builds data centers, and leases compute to OpenAI, Microsoft, Meta, and other large customers under long-term contracts. In Q2 2026 (ended June 30), revenue was $2.575B, up 112% year over year, gross margin 66%, net loss $626M. Contracted backlog reached $129B (adding $29.6B in six weeks), with 98% of revenue from committed contracts. It hedges GPU depreciation and debt interest (Q2 net interest expense $640M) by locking demand in advance.
Together AI (private) is the asset-light resale road. It leases chips from other clouds and resells them to developers, while also buying its own servers and building data centers. Revenue was $44M in 2024; media reported annualized revenue around $1B in March 2026 (more than 3x mid-2025). In July 2026 it closed an $800M Series C at an $8.3B valuation, about 8x price-to-sales. Fireworks AI is another reference: October 2025 Series C at $4B against roughly $280M ARR, about 14x price-to-sales.
Measured against SiliconFlow's 140x price-to-sales (static, on 2025 revenue), the gap is not just business model. Growth rates differ: SiliconFlow +653%, CoreWeave +112%, Together AI roughly +200-300% (annualized revenue up 3x from mid-2025 to early 2026). Market stage differs: China's token market grew 1,602.6% from 2024 to 2025 and is in early explosion; the US inference cloud has moved into a contract-based maturity phase. So "model determines valuation" needs two more variables: the model determines the loss structure, while growth rate and market stage determine the multiple. Together they explain the gap between 140x and 8-14x.
The comparison's conclusion: SiliconFlow is "Together AI's business model plus CoreWeave's earlier growth stage" — asset-light, high growth, deep losses, with a valuation anchored to China's token market explosion, not to current cash flow.
VI. Business value and the breakeven calculation
Start with market size. Frost & Sullivan: China's token supply market grew 1,602.6% from 2024 to 2025, and is projected to reach about 53.2 quadrillion tokens by 2030, a 638.3% CAGR from 2025. IDC: China's public cloud MaaS market was RMB 3.07B in 2025, with token consumption in 2026 projected at 40,000 trillion, up about 20x from 2025.
But the volume explosion is accompanied by a price collapse. Since 2023, leading vendors have cut API prices more than ten times; some mainstream models' per-thousand-token prices are down over 90%. In May 2026, DeepSeek announced a permanent 75% cut for V4-Pro, Tencent Cloud followed with up to 97.5% off, and Xiaomi followed with up to 99%. For a middleman earning on compute spreads, price wars compress the room to survive. SiliconFlow needs throughput growth to outrun price declines just to keep revenue growing: it managed in 2025 (+653% revenue versus falling unit prices), but the 2026 cuts are steeper.
How much revenue does breakeven require? The following sensitivity model is our calculation, not a company forecast.
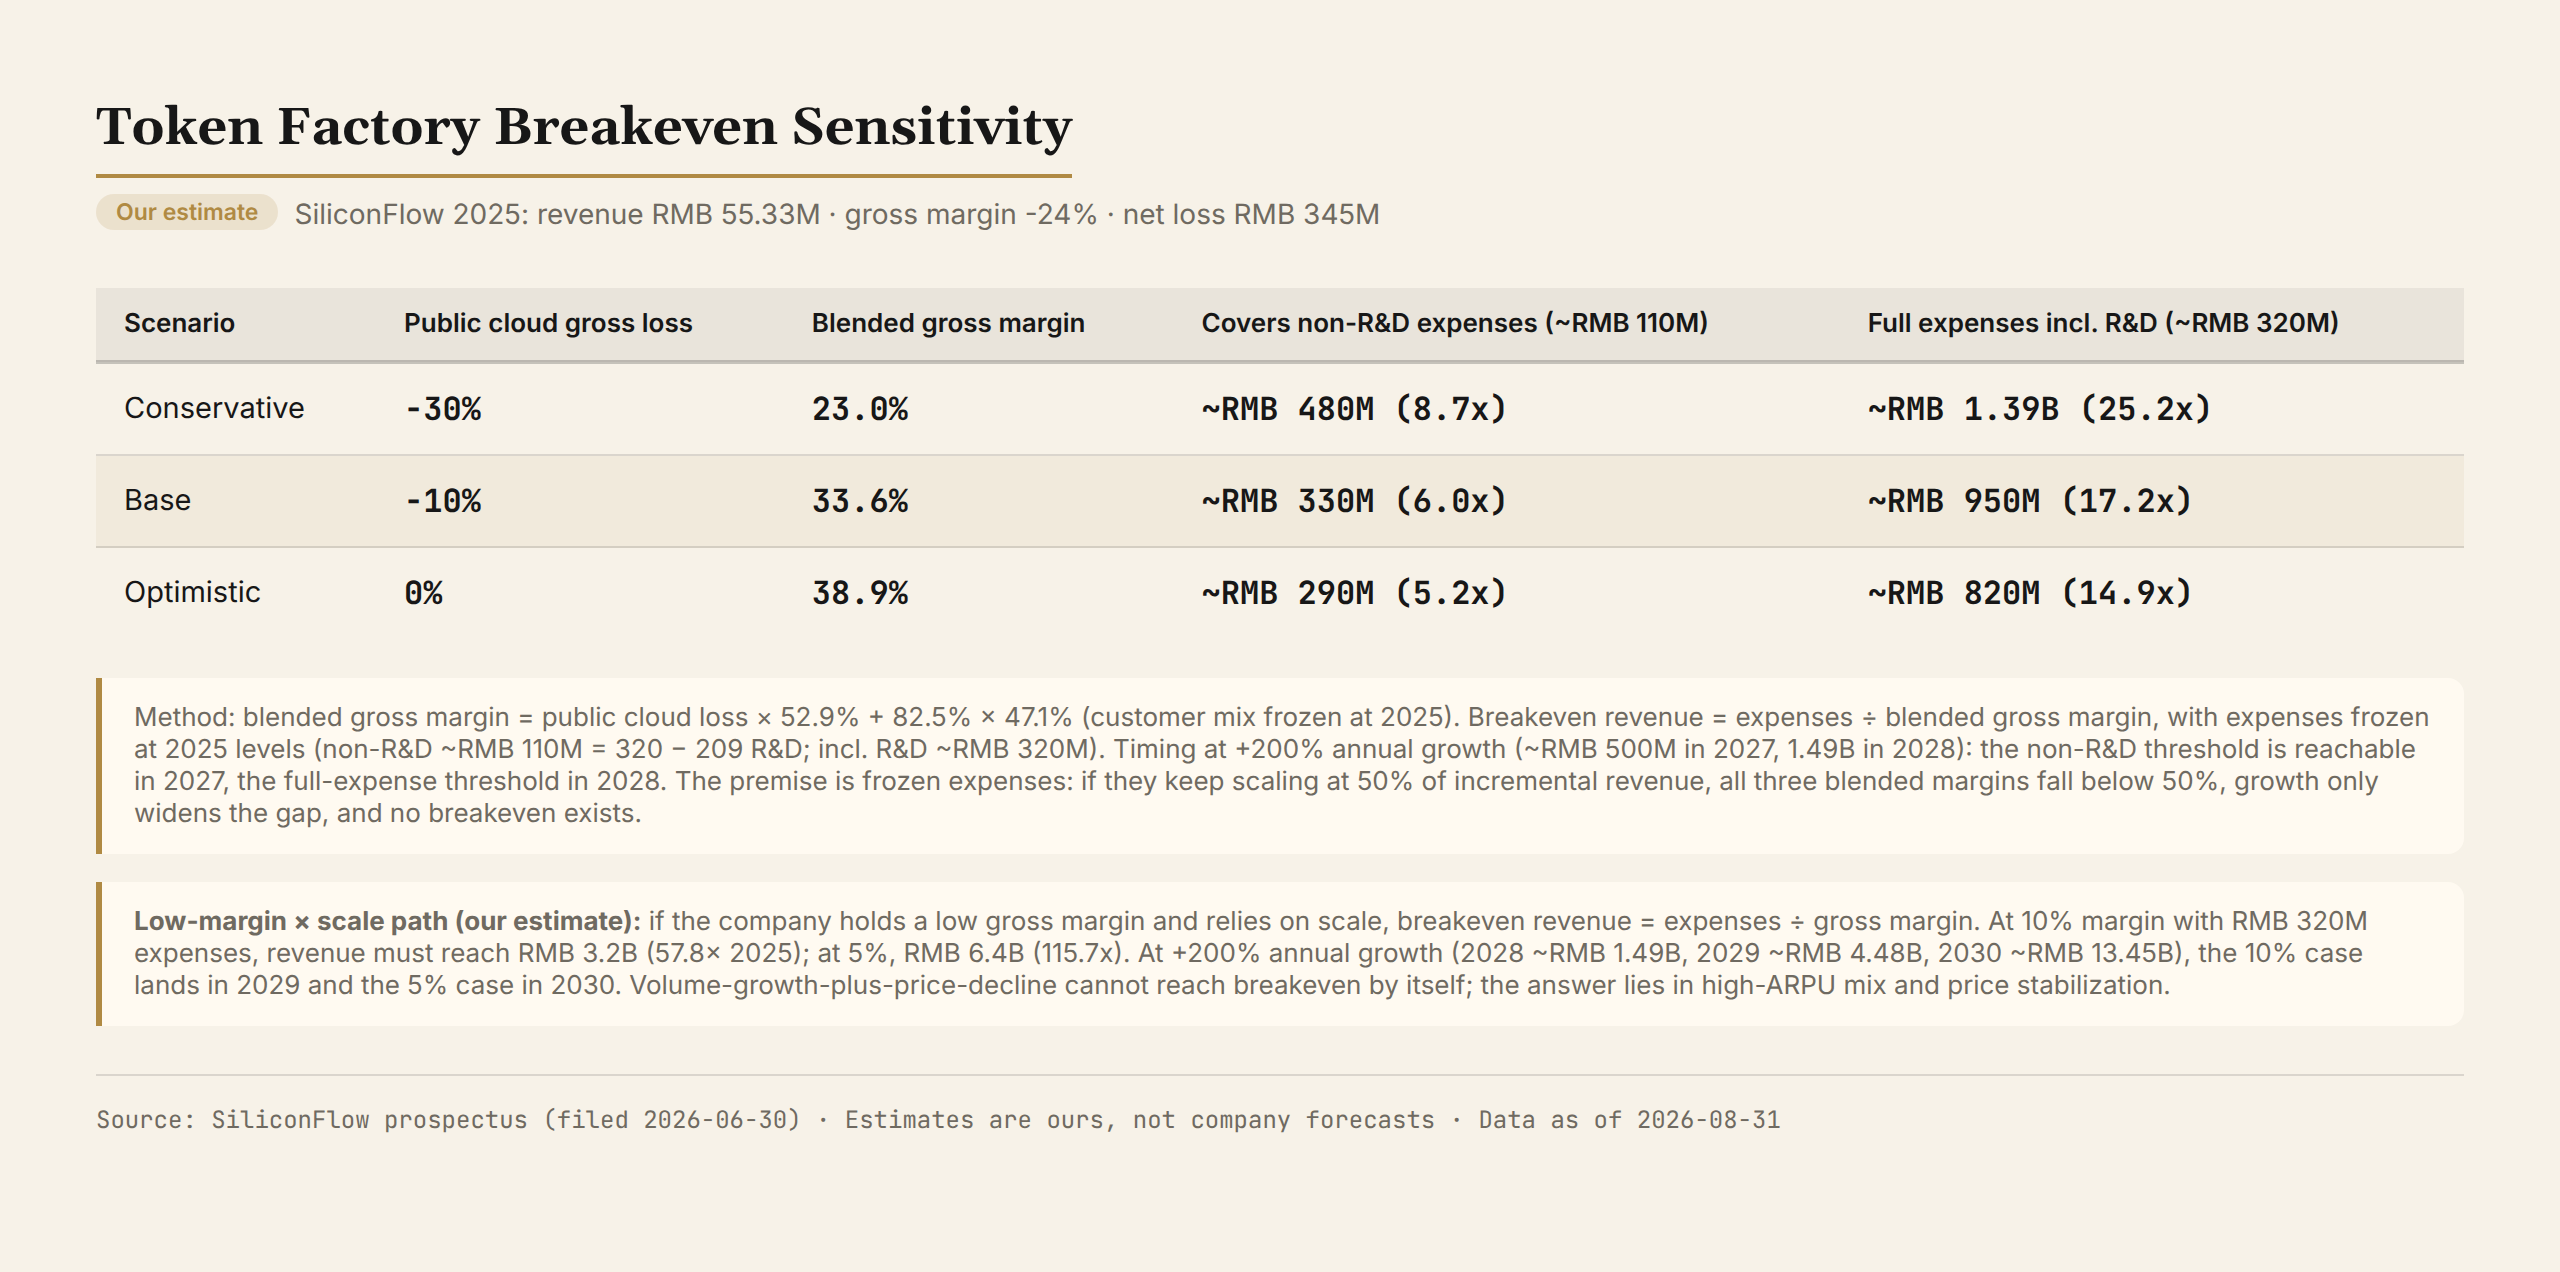
Key assumptions: ① public cloud gross loss rate narrows from -119% (utilization up, free vouchers down) to -30%/-10%/0% across three scenarios; ② on-premises gross margin holds at 82.5%; ③ customer mix frozen at 2025 levels (public cloud 52.9%, on-premises 47.1%, scaling proportionally with revenue); ④ expenses frozen at 2025 levels (R&D 209M + sales & marketing 84M, with G&A bringing the total to roughly RMB 320M, of which non-R&D is about RMB 110M). The breakeven question: once margins repair, how much revenue covers the existing cost base?
| Scenario | Public cloud gross loss | Blended gross margin | Covers non-R&D expenses (~RMB 110M) | Full expenses incl. R&D (~RMB 320M) |
|---|---|---|---|---|
| Conservative | -30% | 23.0% | ~RMB 480M (8.7x) | ~RMB 1.39B (25.2x) |
| Base | -10% | 33.6% | ~RMB 330M (6.0x) | ~RMB 950M (17.2x) |
| Optimistic | 0% | 38.9% | ~RMB 290M (5.2x) | ~RMB 820M (14.9x) |
(Methodology: blended gross margin = public cloud gross loss × 52.9% + 82.5% × 47.1%, giving 23.0%/33.6%/38.9% across the three scenarios; breakeven revenue = expenses ÷ blended gross margin, with multiples against 2025 revenue of RMB 55.33M. R&D is listed separately because it is the most adjustable expense line: treated as compressible, about RMB 330M of revenue covers operating expenses in the base case; held at 2025 intensity, the threshold rises to RMB 820M-1.39B. Timing at +200% annual growth (about RMB 170M in 2026, 500M in 2027, 1.49B in 2028): the non-R&D threshold is reachable in 2027, the full-expense threshold in 2028.)
The table rests on one premise that must be stated plainly: expenses stay frozen. If instead they keep scaling at 50% of incremental revenue as during the land-grab years, all three blended margins (23%-39%) fall below 50%, so every extra RMB 1 of revenue adds only RMB 0.23-0.39 of gross profit against RMB 0.5 of expense; the gap widens and no scenario reaches breakeven. That is the arithmetic of trading losses for volume: growth alone cannot buy breakeven; the gross loss rate must repair first.
Where growth comes from: a volume-price decomposition. The breakeven table answers how much revenue is needed; the next question is where it comes from. The 2025 revenue of RMB 55.33M has three parts: public cloud RMB 29.26M (serverless RMB 14.3M, dedicated instances RMB 15M) and on-premises RMB 26.07M. Growth runs on three lines:
- Volume (token throughput): the market is exploding (638.3% CAGR 2025-2030), but the company's own user growth is flattening (per the operations section: registrations +11.8% in four months, active users collapsing quarter over quarter). Volume is still rising, but the slope is flattening.
- Price (revenue per token): after DeepSeek cut V4-Pro by 75% and Tencent Cloud followed with up to 97.5% off in May 2026, unit prices keep falling. The scissors effect means public cloud revenue growth requires throughput growth to outrun price declines: achieved in 2025 (+653%), but the 2026 cuts are steeper.
- Mix (high-ARPU business): on-premises revenue per customer rose from RMB 224K to RMB 1.303M (+481%), and overseas monthly revenue passed $1M in 2026. The profitable business is getting more expensive per customer, but its customer pool is shrinking (28 to 20).
A volume-price sensitivity estimate (ours, not a forecast): split 2025's RMB 55.33M into serverless (RMB 14.32M) and high-ARPU (dedicated instances RMB 14.95M plus on-premises RMB 26.06M, RMB 41.01M combined; overseas was not yet on the 2025 books; the "over $1M per month" figure is a 2026 run rate). Assume serverless revenue stays roughly flat in 2026 after volume-price offset (about RMB 14M); high-ARPU growing 150% adds about RMB 103M, for roughly RMB 117M total, still about RMB 100M short of the Chapter 18C commercialization threshold (about RMB 220M). To close the gap, high-ARPU growth would need to reach 400%+ (a 20-customer pool cannot support that), or the price war must ease and unit prices stabilize. The volume-growth-price-decline path cannot reach breakeven by itself; the answer lies in high-ARPU mix and price stabilization, both outside the company's control.
What about holding a low margin and relying purely on scale? Look at the breakeven formula from the other side: breakeven revenue = expenses ÷ gross margin. If the company does not repair its gross margin and instead tries to cover costs with volume alone: at a 10% blended margin with full expenses of RMB 320M, revenue must reach RMB 3.2B (57.8x 2025); at 5%, RMB 6.4B (115.7x). Extrapolating at +200% annual growth (2026 ~RMB 170M, 2027 ~RMB 500M, 2028 ~RMB 1.49B, 2029 ~RMB 4.48B, 2030 ~RMB 13.45B): the 10% case lands in 2029, the 5% case not until 2030.
The scale path pushes breakeven to 2029-2030, contingent on +200% growth for five consecutive years and a price-war ceasefire, both outside the company's control. Under the constant-margin assumption, scale dilutes expenses but not gross margin — low margin × scale merely postpones breakeven to 2029-2030, two to three years later than the non-R&D base case.
What about a 5-year return horizon (2026-2030)? Breakeven is a single-year view; returns are cumulative. Our estimate, with revenue, margin, and expense assumptions stated:
| Scenario | Revenue path | Gross margin path (yearly) | Expense path (yearly) | 5-yr cumulative net income (2026-2030) | Turning positive (single-yr / cumulative incl. history) |
|---|---|---|---|---|---|
| A: growth holds | +200%/yr, ~RMB 13.45B by 2030 | -10%/5%/20%/30%/38.9% | RMB 350/420/500/580/650M (scale effects materialize) | +RMB 4.38B | 2029 / 2030 |
| B: growth decays | +200%→+40% decaying yearly: 170M → 420M → 830M → 1.33B → 1.86B | -10%/5%/15%/22%/28% | same | -RMB 1.56B | never (incl. history, ~-RMB 2.0B by 2030) |
(Turning positive has two senses: single-year net income turns positive in 2029; the cumulative sense counts the money already burned from financing (net losses of RMB 440M across 2023-2025) as a cost, and in scenario A the restrained tier is still at -RMB 640M cumulatively at end-2029, turning positive only in 2030. The investor payback point is 2030, not 2029.)
(Note: yearly net income = revenue × gross margin - expenses. The "5-yr cumulative net income" column is the 2026-2030 figure (+RMB 4.38B for the restrained tier); the "cumulative turning point" column is the including-history figure (+RMB 3.94B at end-2030), the difference being the RMB 440M stock of historical losses.)
(Assumptions: revenue extrapolated from the 2025 base of RMB 55.33M. Gross margin repairs yearly (paths in the table above): scenario A tracks the optimistic breakeven tier, scenario B a shallower repair ending at 28%. Expenses are R&D + sales + G&A, rising from about RMB 320M in 2025 to RMB 650M in 2030, so the expense ratio converges from 578% to about 4.8% (650M ÷ 13.45B), starting near 206% in 2026 (350M ÷ 170M). This is the "scale effects materialize" assumption: expenses do not scale with revenue. Scenario A also relaxes the two pessimistic premises used earlier (constant gross margin, expenses growing at 50% of revenue growth), an optimistic deviation by mechanism. If expenses scale with revenue, we are back to "growth cannot buy breakeven" and the 5-year case has no solution.)
The 5-year outcome hinges on three conditions holding simultaneously: growth not decaying (five straight years above +200%), the expense ratio collapsing (from 206% to 4.8%), and gross margin repairing to 38.9% (which depends on the price war easing; in scenario A, nearly all of the ~RMB 4.58B 2030 profit comes from margin repair). The historical evidence cuts against all three: user growth is flattening (+11.8% registrations in four months; active users 5.45M → 1.45M), the high-value customer pool is shrinking (on-premises 28 → 20), and the price war is deepening (V4-Pro -75% after May 2026).
The 140x price-to-sales is pricing exactly this triple condition. If scenario B materializes, the five-year operating cumulative is -RMB 1.56B, or -RMB 2.0B including historical losses, and the multiple needs to converge from 140x price-to-sales to single-digit price-to-sales; if scenario A materializes, the single year turns positive in 2029, the five-year operating cumulative is +RMB 4.38B, covering the RMB 440M of historical losses for a net +RMB 3.94B, and 140x looks cheap. The market's RMB 7.74B valuation is betting on scenario A, with one shot: cash runway is about one year, and a refinancing will be needed in between.
Targeting breakeven by 2030: can spending go up? Flip the question: the 2030 expense ceiling = 2030 revenue × that year's gross margin. Scenario A (RMB 13.45B × 38.9%) gives a ceiling of about RMB 5.23B a year; scenario B (RMB 1.86B × 28%) only RMB 520M. The answer to "can we invest more" is opposite in the two scenarios.
Three spending tiers under scenario A (our estimate; revenue and margin paths as above):
| Tier | Expense path (yearly) | 5-yr cumulative net income (2026-2030) | Single-yr turning point | Cumulative turning point (incl. RMB 440M historical losses) | Loss trough | Financing need |
|---|---|---|---|---|---|---|
| Restrained | RMB 350/420/500/580/650M | +RMB 4.38B | 2029 | 2030 (+RMB 3.94B, covering RMB 1.951B raised) | -RMB 960M | ~RMB 1.6B |
| Assertive | RMB 450/600/800/1000/1200M | +RMB 2.83B | 2029 | 2030 (+RMB 2.39B, barely covering RMB 2.2B) | -RMB 1.54B | ~RMB 2.2B |
| Aggressive | RMB 600/800/1000/1200/1500M | +RMB 1.78B | 2029 | 2030 (+RMB 1.34B, short of RMB 2.7B) | -RMB 2.09B | ~RMB 2.7B |
(Financing need = loss trough + RMB 440M of cumulative net losses 2023-2025 + about RMB 200M of buffer, rounded up; this is the full-cycle total financing need (raised plus planned raises combined), including historical spend. Against the RMB 1.951B already raised: the restrained tier needs about RMB 1.6B in total, so existing financing has room to spare; the assertive tier about RMB 2.2B, requiring roughly RMB 250M more; the aggressive tier about RMB 2.7B, requiring roughly RMB 750M more.)
All three tiers turn positive on a single-year basis in 2029; once financing is counted as a cost (net losses of RMB 440M across 2023-2025), cumulative net income (including historical losses, a proxy for the cash view) does not turn positive until 2030. The restrained tier is still at -RMB 640M cumulatively at end-2029, pulled to +RMB 3.94B in one stroke by the RMB 4.58B single-year profit of 2030. The assertive tier ends 2030 at +RMB 2.39B, the aggressive tier at +RMB 1.34B.
The single-year turning point is set by the gross-profit curve (revenue × margin): 2028 gross profit of RMB 3.0B is below the lowest tier expenses of RMB 5.0B, while 2029 gross profit of RMB 13.4B exceeds the highest tier expenses of RMB 12.0B, and all three tiers fall inside that gap. The cumulative turning point also depends on the stock of historical losses and the size of later profits; all three tiers rely on the 2030 single-year profit to flip cumulative net income in one stroke.
Cumulative breakeven is not the same as recovering the financing: the restrained tier covers the RMB 1.951B raised with room to spare, the assertive tier barely covers its RMB 2.2B need (raised plus planned), and the aggressive tier falls short of its roughly RMB 2.7B full-cycle need, with investors recovering only about half their principal by end-2030 (1.34 ÷ 2.7 ≈ 49%). With the paths fixed, the spending tier moves 5-year cumulative income (+4.38B to +2.83B to +1.78B), the loss trough (-960M to -2.09B), financing need (1.6B to 2.7B), and financing recovery. The assertive tier means R&D expanding to RMB 1B a year and sales doubling, without moving the single-year turning point. The cost is 1.55B less cumulative income, RMB 1.1B more financing, and the risk of unrecovered principal.
Scenario B is the opposite: the expense ceiling of RMB 520M is below even the restrained path's RMB 650M. At 28% margin, RMB 1.86B of revenue supports only a RMB 5B-odd expense base.
Spending more only deepens the loss.
The call: heavier spending is a call option on scenario A and poison under scenario B. The option's value is not in the table: with revenue and margin paths fixed here, heavier spending only reduces cumulative income; the option holds only through an off-model channel: more spending lifting growth itself (stronger products, higher share, faster revenue). And the decision must be made in advance (R&D and compute pre-commitments lag one to two years); the company cannot wait for the scenario to clarify before betting. SiliconFlow's posture is already clear: R&D of RMB 209M in 2025 (3.78x revenue) plus RMB 54.21M of free-token subsidies. But on a full-expense basis (about RMB 320M) it actually sits near the restrained tier — aggressive posture and an assertive tier are separated by the revenue-fulfillment gap. The size of the IPO raise determines whether it can afford to move up a tier.
Constraints:
- Chapter 18C commercialization threshold: latest-year revenue of HK$250M (about RMB 220M); the company expects to reach it by end-2026. Listing hits the threshold; hitting it is not profitability.
- Cash runway: cash and equivalents of RMB 172M at end-2025, burning about RMB 14.8M per month, roughly one year of runway. The Series B/B+ rounds actually banked RMB 1.26B in 2026 (the company announced "over RMB 2B"; the gap versus the prospectus is about RMB 700M and has drawn market questions). Cumulative losses are RMB 440M. How IPO proceeds are used (expanding compute, repaying redemption liabilities) directly determines whether cash lasts to breakeven.
- Supplier concentration: top five suppliers account for 70.8% of purchases and the largest single supplier 20.4% (2025); the availability of Ascend-class domestic compute caps compute cost.
Business value judgment: the value lies in the window of orchestration scale, not in proprietary technology. Whoever packs the most heterogeneous chips and the most models into one elastic pool during the fragmentation phase grabs the starting point of scale effects. SiliconFlow has validated the demand side (12x throughput, 292x paying customers), but the cost side has not turned the corner (gross margin -24%, public cloud -119%).
Stack the four layers of modeling and the business comes into focus. On a single-year view, once gross margin repairs, RMB 290-480M of revenue covers operating expenses (whether R&D is counted sets the tier), a lower bar than it looks. On growth, volume gains net of price declines cannot reach the Chapter 18C threshold alone; the gap must be filled by high-ARPU mix and price stabilization. On a 5-year view, cumulative payback rests on three conditions (growth not decaying, the expense ratio collapsing, gross margin repairing to 38.9%): if they hold, payback lands in 2030 and 140x price-to-sales looks cheap; if not, cumulative losses including historical losses reach about RMB 2.0B and the multiple converges to single-digit price-to-sales.
On spending, heavier investment is a call option under scenario A and poison under B, and even where the aggressive tier turns cumulatively positive in 2030, investors recover only about half their principal.
Its business value is proof that compute wholesale has room for an independent third party in China (1.5% share, the only independent in the top five). But the four layers interlock; break any one and 140x price-to-sales is pricing a story, not cash flow.
Summary
A Token Factory is a trade-scale-for-losses middleman business: upstream compute leasing costs are rigid, downstream token price wars have no floor, and the middleman buys traffic with subsidies. SiliconFlow's ledger shows the structure clearly: public cloud sells at a loss as strategy (claim the ecosystem position), on-premises sells at a margin as reality (stay alive), and R&D burns money as a bet on the future (technical barrier).
Against overseas benchmarks: CoreWeave locks demand with contracts, earns 66% gross margin, and carries the obligation to deliver $129B of backlog. Together AI reached 8x price-to-sales with asset-light resale. SiliconFlow prices China's token market explosion at 140x. Together they show that Token Factories have no single valuation anchor: the market prices a combination of growth, market stage, and model.
For anyone entering this business, the four layers of modeling give four coordinates. Single-year breakeven hinges on margin repair (utilization sets unit cost, the exit of free subsidies sets gross margin). Growth hinges on the volume-price split: volume gains net of price declines cannot reach the threshold alone, and high-ARPU accumulation is the only way through. Payback hinges on three conditions holding together (growth, expense ratio, and gross margin), with 2030 as the cumulative break-even point. Spending hinges on scenario fit: heavier investment is an option when growth delivers, poison when it does not.
The hardest of the four is high-value retention: across three years, SiliconFlow's top-five customer lists share not a single name, retention has yet to materialize, and 140x price-to-sales is betting precisely on that unproven retention. The first verifiable checkpoint after listing is whether 2026 gross margin turns positive. If it stays negative, the first domino of the three conditions falls, and the correction of 140x price-to-sales will arrive faster than the market expects.
Data as of 2026-08-31. SiliconFlow financial and operating data from the HKEX prospectus (filed 2026-06-30); CoreWeave data from Q2 2026 results (2026-08-11); Together AI and Fireworks AI valuations from media reports (The Information/Reuters); market data from Frost & Sullivan and IDC; breakeven calculation is our estimate with assumptions stated above.