

A fleet of 10,000 B300 GPUs does not determine its own revenue. Renting the same machines, running different models and promising different response times create different capacities, prices and costs. Connecting those operating conditions to cash receipts and payments is how we establish the funding required, the return and the maximum affordable equipment price.
This article builds a reproducible reference case: 1,250 eight-GPU servers, one construction year and five operating years, combining long leases, short leases and token services. A single project company owns and operates the assets. Procurement, rent, demand, construction costs and financing are scenario assumptions, not acquired quotations, orders, lawful delivery eligibility or credit commitments. The technical starting points come from the public tests identified below.
At RMB 7 million per server, approximately RMB 11.35 billion is needed before revenue begins. Project IRR is about 7.3% and equity IRR about 8.7%, below the assumed hurdles of 10% and 12%. These conditions do not support approving the whole investment at once. Investing in a Token Factory: High Rental Rates Do Not Make a Good Investment discusses the decision; here we work through the calculation and the conditions that can change it.
Funding Before Revenue: RMB 11.35 Billion
Buying 1,250 servers at RMB 7 million each costs RMB 8.75 billion. External networking, shared storage, facilities and integration bring initial capital expenditure to RMB 10.8 billion.
| Use of funds | RMB billion | Scope in this case |
|---|---|---|
| GPU servers | 8.750 | Includes 63 spare servers; required host configuration and warranty must be covered |
| External networking and shared storage | 1.000 | Switches, optics, cabling and shared storage |
| Site and facilities | 0.850 | Land, construction, electrical distribution, cooling and connections |
| Software, installation and commissioning | 0.200 | RMB 0.100 billion each; remove overlapping scope from quotations |
| Initial CapEx | 10.800 | Expenditure to create usable assets |
| Startup expense | 0.100 | Paid before operation; deductible in the first operating year for this model |
| Initial working capital | 0.24933 | One month of first-year revenue |
| Minimum operating cash | 0.200 | Held during operation and released at exit |
| Total funding before revenue | 11.34933 | More than the equipment purchase alone |
Financing determines who provides these funds. Debt covers half of initial CapEx, or RMB 5.4 billion, drawn at completion. Shareholders contribute approximately RMB 5.95 billion across the construction and startup dates. Debt reduces their contribution, not the uses of funds needed to complete the project.
Half the initial CapEx is paid at construction start and half one year later. A real project needs the actual deposit, delivery, acceptance and retention dates. If the completion loan cannot be drawn and the original plan is still pursued, RMB 5.4 billion of replacement financing is needed absent other arrangements. That is a different problem from incremental working-capital needs during normal operation.
Calculate Three Revenue Streams Separately
Allocate 500 servers to long leases and 63 to spares. The remaining 687 can support short leases or token services. Spare equipment is already in the procurement total; it must not be added again.
Long leases assume uninterrupted payments of RMB 235,000 per server per month for five years. Annual revenue is RMB 1.41 billion. This assumes the minimum payments are fulfilled, rather than approximating an average occupancy rate. Contracts allowing early termination, billing suspension or service credits require different cash flows.
Short leases sell only paid server-time. Monthly quoted prices follow RMB 340,000, 300,000, 260,000, 220,000 and 180,000. Annual demand equals 262.2, 187.2, 112.2, 75 and 37.2 fully paid server-years. Each allocated server can be billed for at most 60% of the year. Sales are the smaller of demand and available billable capacity. Demand already expressed in paid server-time is not multiplied by 60% a second time.
Token services comprise GLM-5.2 interactive service, a queue-tolerant DeepSeek V4 Pro service, Kimi K3 long-context service, and fast-response and standard V4.1 Flash tiers. Every service has two limits: what customers will pay for and what the equipment can deliver under the required conditions.
Paid output = min(customer output demand,
                  servers x reference output rate x technical factor
                  x saleable-capacity factor x time)
Input volume = paid output x workload-matched input/output ratio
Revenue = sum(tokens in each billing category / 1,000,000
              x net price per million tokens in that category)
Input is assigned to mutually exclusive cache-read, cache-write or uncached categories, with output billed separately. Minimum-spend commitments cannot be added to usage charges they offset. No extra revenue from tools, service fees or new volume commitments is assumed here.
| Revenue, RMB billion | Year 1 | Year 2 | Year 3 | Year 4 | Year 5 |
|---|---|---|---|---|---|
| Long leases | 1.410 | 1.410 | 1.410 | 1.410 | 1.410 |
| Short leases | 1.070 | 0.674 | 0.350 | 0.198 | 0.080 |
| Token services | 0.512 | 1.095 | 1.725 | 1.940 | 2.032 |
| Total | 2.992 | 3.179 | 3.485 | 3.548 | 3.522 |
Totals use unrounded values. The central operating assumption is that token growth replaces declining short-lease revenue. Token revenue grows about 41% annually across four intervals, reaching approximately RMB 169 million per month in year five. This needs a customer integration, expansion and renewal plan, not just a growth rate in a spreadsheet.
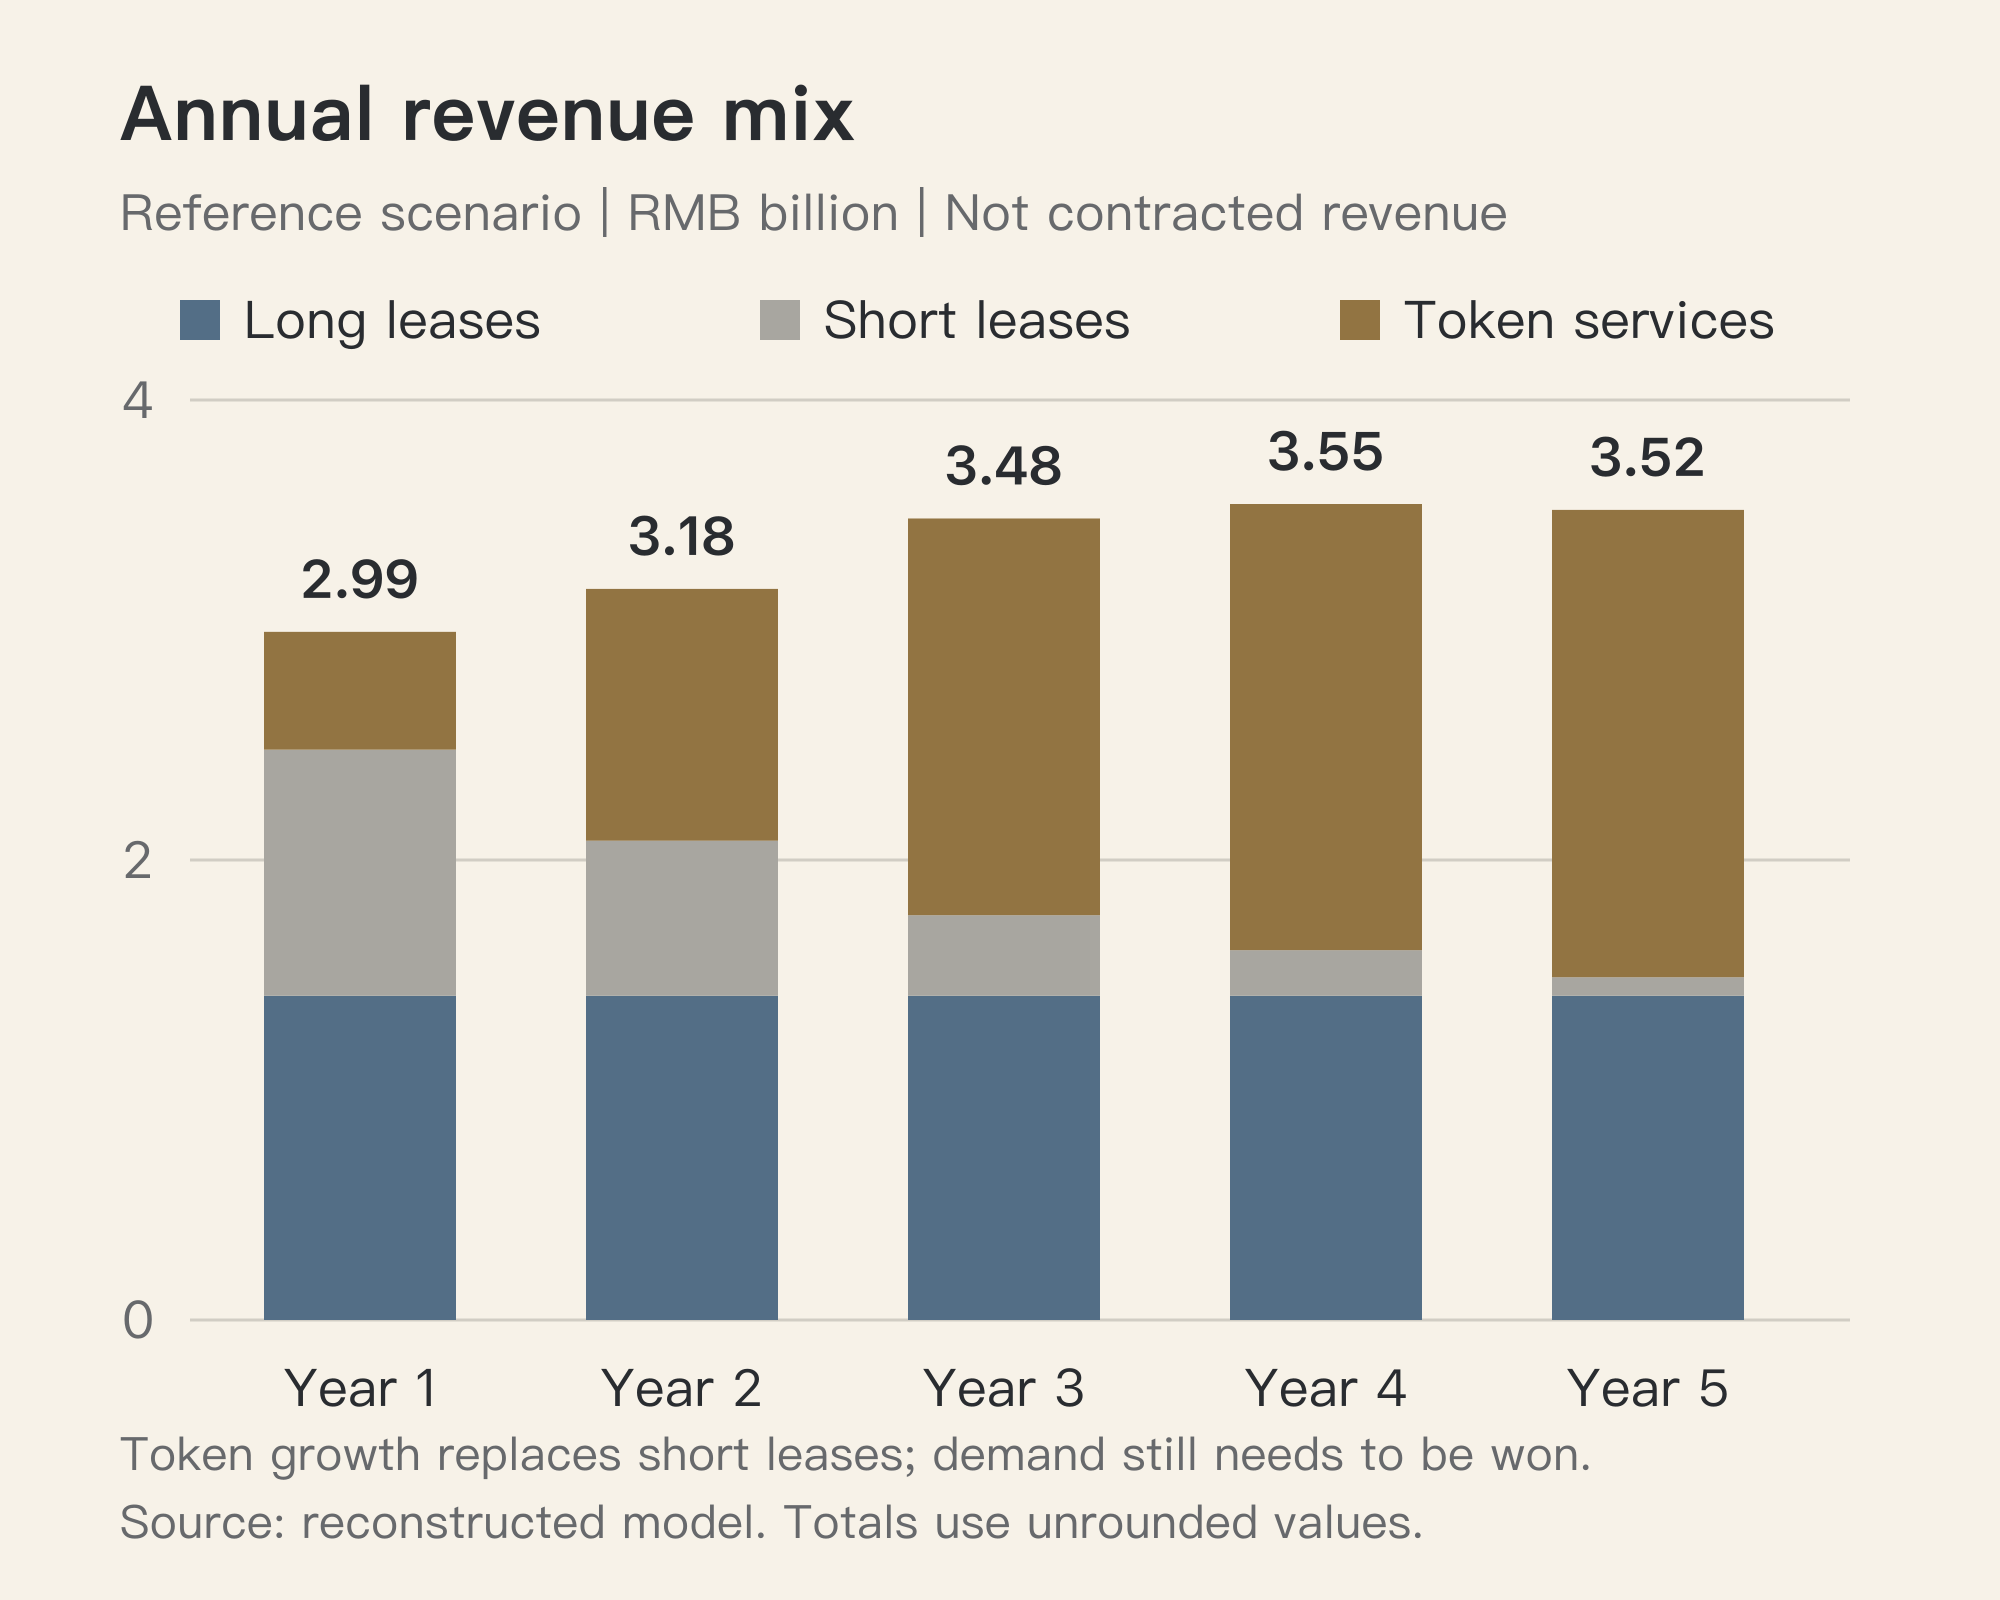
Even if all 500 long leases are signed, their five-year revenue is only RMB 7.05 billion. Approximately RMB 9.68 billion must still come from short leases and token services. Procurement should match orders that can be served, not merely a forecast market size.
Turning Benchmarks Into Billable Capacity
The selected public tests retain complete deployment costs. Prefill GPUs cannot disappear from the budget simply because decode GPUs generate the output. "Per-server equivalent" allocates the cost of a complete deployment; it does not mean the model can run independently on one server.
| Product and operating point | Complete deployment | Output tokens/s per server-equivalent | Conditions to retain |
|---|---|---|---|
| GLM-5.2-NVFP4, approximately 8K input | 3 servers, 24 B300 GPUs | 5,882.33 | Fixed-length random workload, no prefix caching; mean TTFT about 1.92 s |
| V4 Pro, higher throughput | 2 servers, 16 B300 GPUs | 6,448.48 | FP4, 8K/1K; median TTFT about 18.88 s; queue-tolerant service |
| V4 Pro, shorter-wait comparison | 4 servers, 28 active GPUs | 1,241.50 | Median TTFT about 3.03 s; unused GPUs still carry server costs |
| Kimi K3 | 1 server, 8 B300 GPUs | 564.57 | Concurrency 32; 2,249 GB of CPU DRAM allocated for offload, plus host operating headroom |
| V4.1 Flash, fast response | 2 B300 GPUs per instance | 996.72 across four reference replicas | Co-location remains unverified; modeled output also receives a 70% technical factor |
| V4.1 Flash, standard | 2 B300 GPUs per instance | 5,149.88 across four reference replicas | Same co-location condition; most input is cached |
GLM data comes from DaoCloud's test published by vLLM. Pro uses NVIDIA's raw records for the July 30, 2026 B300 FP4 8K/1K deployments. The higher-throughput point has eight prefill GPUs and eight decode GPUs; total output is then allocated across two servers. The tested model and Pro-0813 pricing still need a version-matched validation before commercial acceptance.
K3 uses record 439940 from InferenceX on August 16, 2026: vLLM, FP4 and concurrency 32. Prefill and decode share the same eight GPUs; they must not be added into sixteen. The 2,249 GB CPU DRAM allocation is not the whole host memory requirement. Flash uses October 9 records 444426 and 444420: SGLang, FP4, two-GPU instances, at concurrency 4 and 32 respectively. P90 TTFT is approximately 1.33 and 5.70 seconds; P90 time per output token is about 2.81 and 6.12 milliseconds. These are test statistics, not promised project SLAs.
A common annual saleable-capacity factor of 80% is applied. This is neither rental occupancy nor a contractual availability guarantee. Downtime, maintenance, unusable output and delivery losses need clear ownership to avoid counting them twice. Flash's separate 70% technical factor represents deployment uncertainty; it does not replace a production test of four co-located replicas.
Acceptance testing must use the actual hardware, matching model versions and customer workloads, measuring quality, success rates, TTFT, generation speed and billing together. Acceptable averages do not establish acceptable tail latency or performance on every request.
High Margins Depend First on How Input Is Billed
Reference prices distinguish uncached input, cached input and output. All rates below are RMB per million tokens, not realized transaction prices for this factory.
| Model | Uncached input | Cached input | Output |
|---|---|---|---|
| DeepSeek V4.1 Flash, peak | 2.00 | 0.04 | 8.00 |
| DeepSeek V4 Pro-0813, peak | 9.00 | 0.30 | 27.00 |
| GLM-5.2 | 8.00 | 2.00 | 28.00 |
| Kimi K3 | 20.00 | 2.00 | 100.00 |
Pricing rules: DeepSeek, Zhipu and Kimi. Real operations must substitute contract prices matched to date, currency, model version and service conditions.
The realized-price factor, delta, is 50% of the reference price within each billing category. It is not a gross margin. DeepSeek also receives a time-of-use factor of 29/48, assuming uniformly distributed volume in an ordinary week without public holidays. Actual dates and customer traffic must replace that simplification. GLM and Kimi do not receive this factor. Annual price indices are 100%, 95%, 90%, 85% and 80%; no automatic hardware-generation speedup is assumed.
If a measured net blended price already incorporates caching and time-of-use discounts, use that price with matching volume rather than discounting it again. Channel, settlement and other cash expenses remain separate costs, not revenue discounts.
Under first-year conditions, with output at the assumed saleable limit and all of it sold, unit economics are:
| Per server-equivalent, RMB thousand/month | Revenue | Operating profit including depreciation |
|---|---|---|
| GLM-5.2 | 578.4 | 301.8 |
| V4 Pro | 405.5 | 154.8 |
| Long lease | 235.0 | 76.9 |
| Flash standard | 62.1 | -137.0 |
Common depreciation and fixed costs are allocated across all 1,187 non-spare servers, including idle ones, at about RMB 155,800 per server-month. The token team is allocated over the 147 first-year service servers, adding approximately RMB 34,000. Business-specific variable expenses are then deducted. These are management-accounting profits, not financial-statement gross margins, and not actual annual average profits. Annual sales are still capped by demand.
The most consequential pricing assumption is that GLM and Pro input is initially billed entirely as uncached. They account for about 83.5% of five-year token revenue, much of it from input. Holding customer opportunities, technical capacity and other cost rules constant, changing only the share billed at cached-input rates and recalculating allocation, working capital and cash flow gives:
| GLM/Pro input billed at cached rates | Project IRR | Equity IRR | Nominal equity gain, RMB billion | Server price ceiling at 10% project IRR, RMB million |
|---|---|---|---|---|
| 0% | 7.27% | 8.74% | 2.632 | 6.0421 |
| 50% | 5.01% | 5.30% | 1.513 | 5.3013 |
| 90% | 3.09% | 2.26% | 0.617 | 4.7088 |
This changes billing categories, not physical cache hit rates. Real caching improvements can also alter prefill cost, throughput and waiting time. Those effects need a workload-matched test; deliberately reducing cache hits is not a revenue strategy.
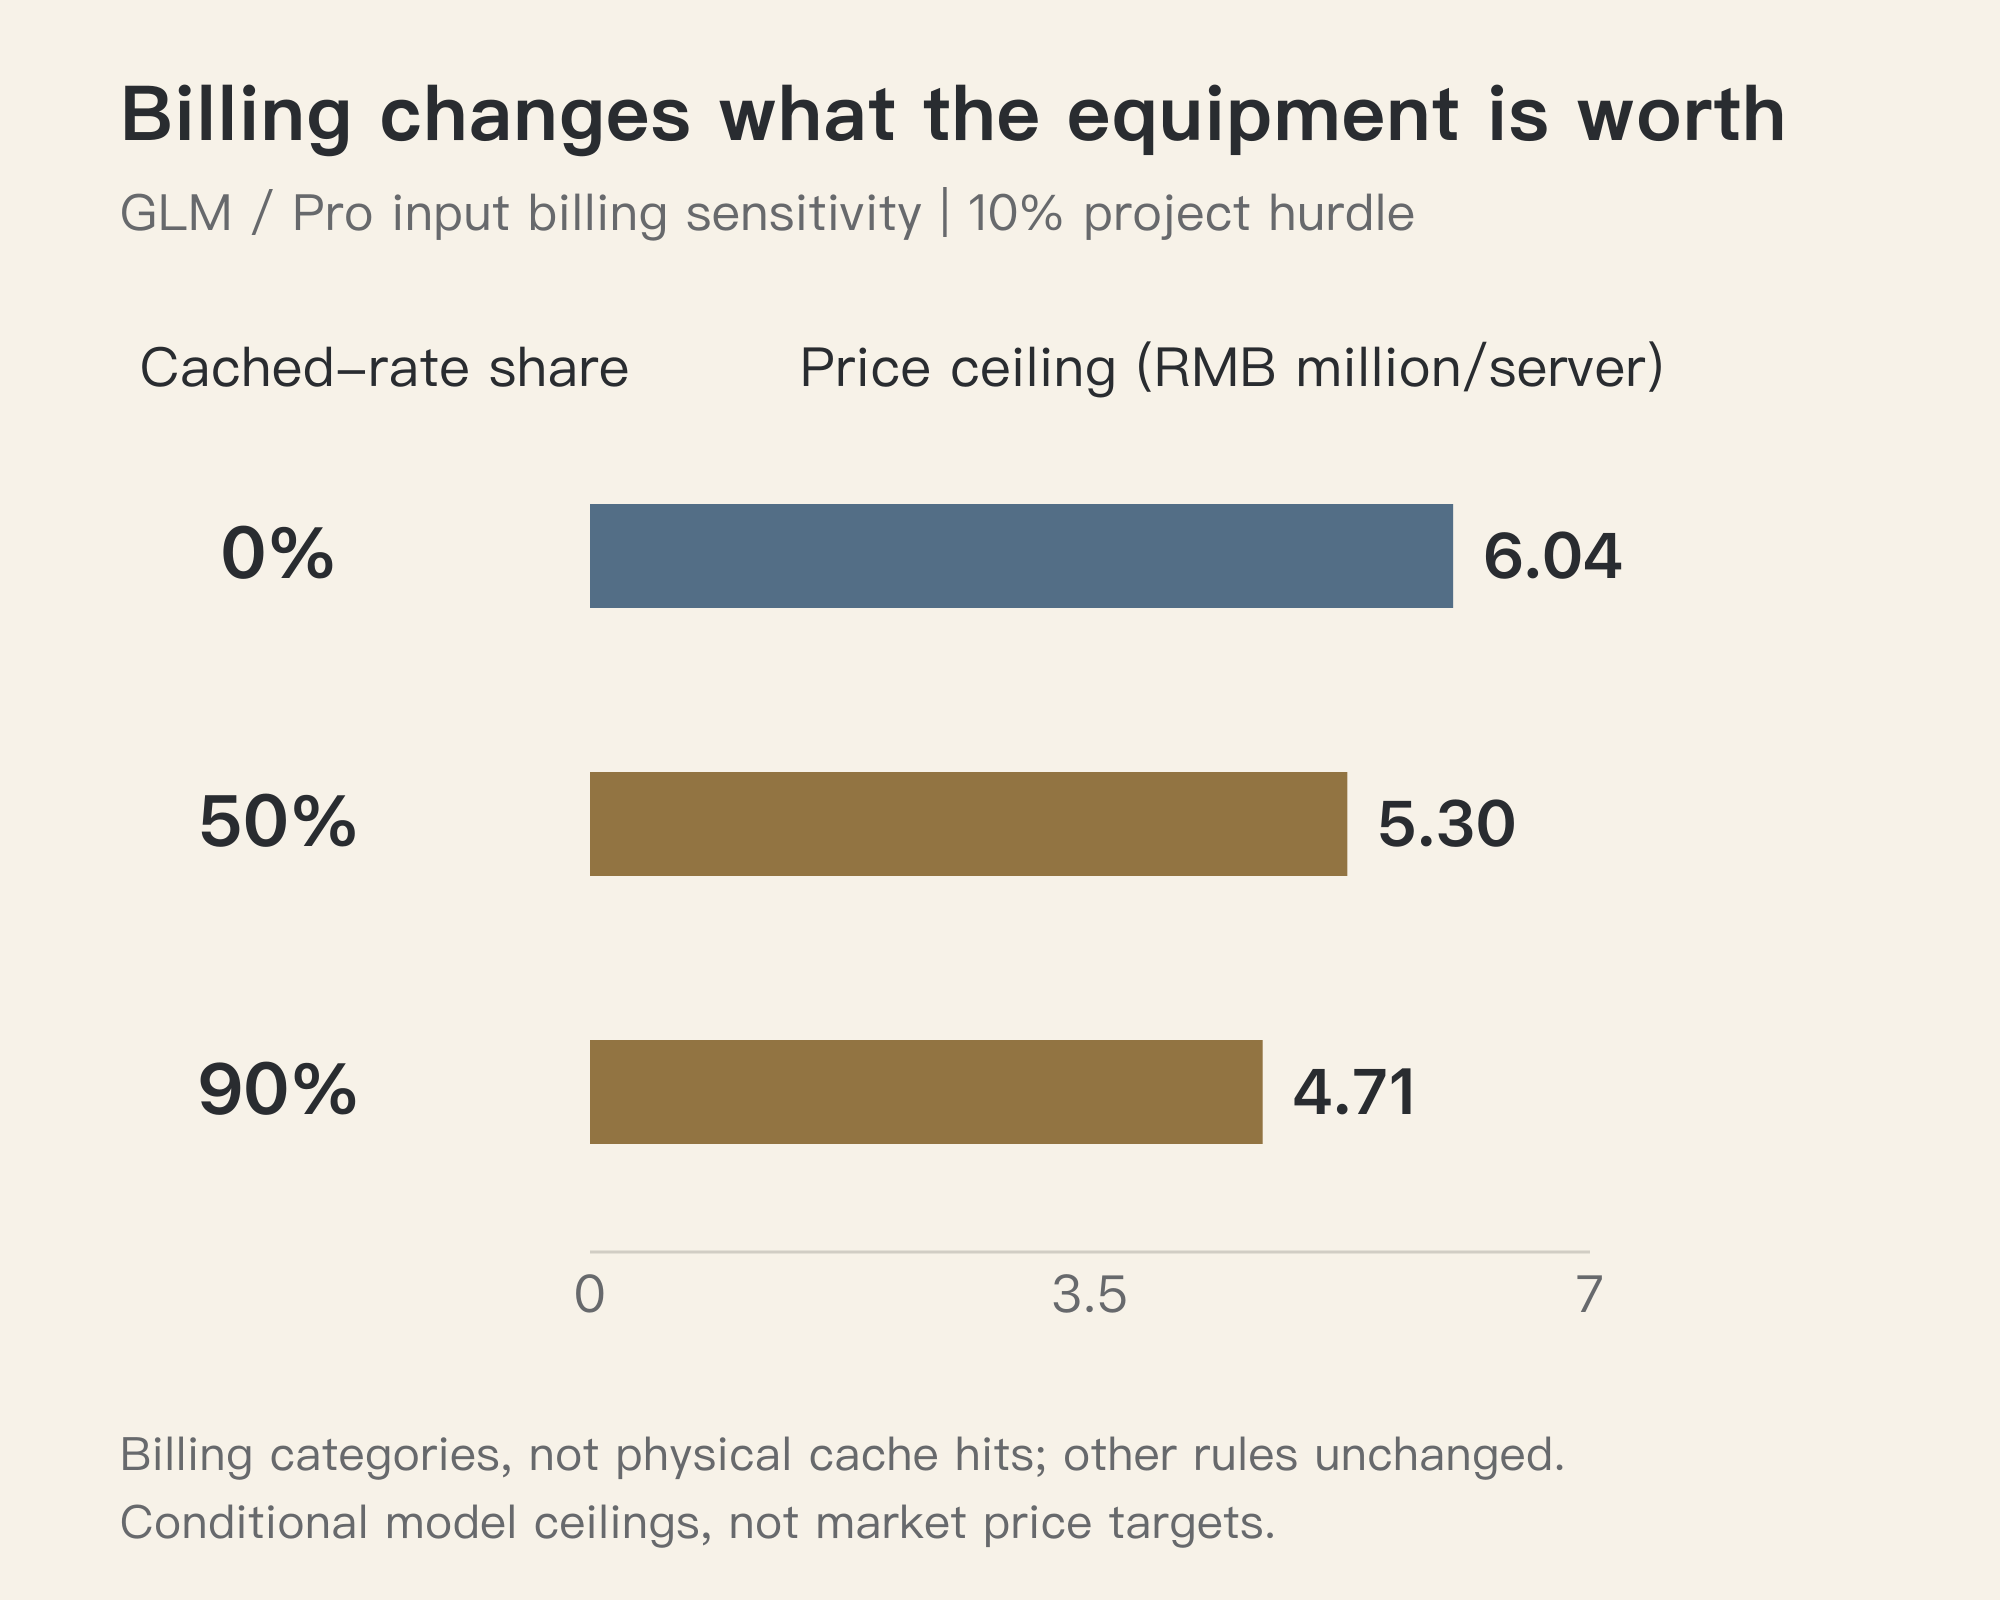
For Flash, the recorded GPU cache hit rates of approximately 97.929% and 96.300% proxy for the billable cached share. K3's approximately 92.814% is constructed from the GPU field of 91.25045% plus the external field of 1.564%, without adding the CPU field again. Denominators and overlap across cache layers still require calibration. None is a verified customer billing share. The K3 case uses the default five-minute write rate of RMB 20 per million tokens, equal to its uncached-input price, treating those categories separately from cache reads. The official one-hour write rate is RMB 40 and requires its own measured volume. Actual write and uncached classifications must be verified against metering records.
K3 also requires a licensing check. A MaaS business meeting the license's combined trailing-twelve-month revenue threshold for the entity and its affiliates, unless an exception applies, needs a separate agreement. An extra cost of 10% of K3 revenue is a budget scenario, not a contractual royalty. See the Kimi K3 license.
Allocate Servers for Achievable Cash Contribution
After fixed long leases and spares, 687 servers are assigned using that year's assumed known opportunities and net cash contributions. GLM requires groups of three servers and Pro groups of two. Other services use whole servers. Idle capacity is allowed. Common electricity and fixed costs are held constant across combinations, so the objective is revenue less business-specific variable costs.
| Server allocation | Year 1 | Year 2 | Year 3 | Year 4 | Year 5 |
|---|---|---|---|---|---|
| Long leases | 500 | 500 | 500 | 500 | 500 |
| Flash fast | 16 | 36 | 18 | 0 | 0 |
| Flash standard | 47 | 106 | 176 | 194 | 217 |
| GLM-5.2 | 45 | 99 | 165 | 198 | 219 |
| V4 Pro | 26 | 58 | 94 | 114 | 126 |
| Kimi K3 | 13 | 29 | 47 | 56 | 63 |
| Short leases | 437 | 312 | 187 | 125 | 62 |
| Unallocated idle | 103 | 47 | 0 | 0 | 0 |
| Spares | 63 | 63 | 63 | 63 | 63 |
| Total | 1,250 | 1,250 | 1,250 | 1,250 | 1,250 |
Token servers rise from 147 to 625 because of assumed demand growth and declining rental opportunities. The model does not prescribe converting half the fleet to self-operation. Nor is this demonstrated real-time scheduling income. Actual decisions can use only opportunities and forecasts available at the time, while respecting switching costs, complete deployment groups and hardware constraints.
Accepting work on equipment already purchased is different from buying new equipment for that work. Flash can be preferable to idling if its incremental cash contribution is positive and no better order exists, even when it does not cover allocated depreciation. Buying specifically for Flash must also cover acquisition, continuing costs and the required capital return.
Idle equipment is not free: staff, facilities, depreciation and some electricity remain in the whole-factory accounts. Unbilled short-lease time has not been sold again as token capacity. Doing so would require contractual rights, usable time windows and valid deployment conditions.
Connect Electricity and Operations to the Same Accounts
At an assumed 15 kW per server, 1,250 servers represent 18.75 MW. Add 1.25 MW for external networking, storage and management nodes to obtain 20 MW of IT load. This is a reference full load, not the annual average.
At an 80% equivalent electrical load factor, annual PUE of 1.25 and RMB 0.50/kWh:
Annual electricity = 20,000 kW x 80% x 8,760 hours x 1.25
                   = 175.2 million kWh
Energy charge = 175.2 million kWh x RMB 0.50/kWh
              = RMB 87.6 million
Annual equivalent electrical load factors are 70%, 75%, 80%, 82% and 82%, separate from billable rental time and saleable token capacity. Actual values must come from active, idle, spare and downtime profiles.
| Cash operating cost | Reference rule |
|---|---|
| Energy charges | Approximately RMB 77-90 million annually |
| Capacity or demand charges | RMB 15 million annually |
| Common operations | RMB 85 million annually: maintenance, staff, shared bandwidth, insurance and administration |
| Token team | RMB 60 million annually: continuing engineering, product and customer support |
| Reallocation costs | RMB 10 million annually |
| Basic variable costs | 1% of long-lease, 3% of short-lease and 15% of token revenue |
| Additional K3 model cost | 10% of K3 revenue; replace with the licensing contract |
Annual maintenance investment of RMB 50 million is CapEx, deducted separately from free cash flow, not counted again in OpEx. Team budgets and revenue-linked cost ratios are assumptions. At constant workload, a price cut need not reduce actual costs proportionately. A formal budget should connect each cost to staffing, workload or contract terms.
Engineering capacity needs a separate review. The NVIDIA user guide lists 14.5 kW consumption and a 15 kW system maximum, while site-planning guidance gives an estimated AC peak of 19.7 kW. The actual OEM configuration must establish peak duration, coincidence and power-capping behavior. Annual PUE is not an electrical connection design. N+1 or 2N redundancy affects installed and failover capacity; it is not a blanket multiplier for normal energy consumption.
From Operating Cash to Shareholder Receipts
Revenue less cash OpEx gives EBITDA. Project operating free cash flow then deducts unlevered operating cash tax, maintenance CapEx and working-capital increases. Debt service is excluded at this level so the asset's return can be evaluated independently.
Initial non-facility assets of RMB 9.95 billion depreciate over five years; facilities of RMB 0.85 billion over twenty. First-year depreciation is RMB 2.0325 billion. Each maintenance CapEx installment depreciates over five years starting the following year. The assumed income-tax rate is 25%. Project and levered calculations roll tax losses forward separately, rather than treating accounting losses as immediate refunds. Actual tax treatment needs project-specific confirmation.
Treating the entire facility budget as a twenty-year depreciation pool is a simplifying convention used to reproduce this reference calculation, not a claim that land, buildings and all supporting equipment share the same tax treatment. An investment-grade model must separate asset classes, land-related rights and their tax bases, then recompute depreciation, amortization, disposal tax and returns. The exit tax basis below uses the same simplifying convention.
| Operating cash, RMB billion, excluding exit | Year 1 | Year 2 | Year 3 | Year 4 | Year 5 |
|---|---|---|---|---|---|
| Revenue | 2.992 | 3.179 | 3.485 | 3.548 | 3.522 |
| Cash OpEx | 0.375 | 0.461 | 0.558 | 0.590 | 0.601 |
| EBITDA | 2.617 | 2.717 | 2.927 | 2.958 | 2.921 |
| Unlevered operating cash tax | 0.121 | 0.169 | 0.219 | 0.224 | 0.212 |
| Maintenance CapEx | 0.050 | 0.050 | 0.050 | 0.050 | 0.050 |
| Increase in working capital | 0.0000 | 0.0156 | 0.0255 | 0.0052 | -0.0021 |
| Project operating free cash flow | 2.446 | 2.483 | 2.633 | 2.679 | 2.661 |
| Equity cash after debt service | 1.123 | 1.209 | 1.407 | 1.502 | 1.532 |
Initial working capital is prefunded, so it is not deducted again in year one. Subsequent targets remain one month of revenue; only the change is deducted. Falling revenue can release working capital, provided customers pay their receivables.
The RMB 5.4 billion loan carries 6% interest and equal annual principal repayments of RMB 1.08 billion for five years. Interest totals RMB 972 million, with a RMB 243 million tax shield in this reference case:
Project operating free cash flow     RMB 12.90166 billion
- principal repayments                RMB 5.40000 billion
- interest                            RMB 0.97200 billion
+ interest tax shield                 RMB 0.24300 billion
= shareholder operating cash          RMB 6.77266 billion
An interest tax shield produces current savings only when taxable income can absorb it. The reference shield must not be pasted into loss scenarios. Actual distributions also depend on reserves, committed expenses and loan covenants. Project-finance payment priorities cannot be replaced with an assumption that all available cash goes to shareholders.
Debt-service coverage is cash available for debt service divided by principal and interest due. The lowest annual DSCR here is about 1.80. However, long-lease revenue after its 1% variable cost is only RMB 1.3959 billion, below first-year debt service of RMB 1.404 billion even before common expenses. Long leases establish a revenue base; they do not independently guarantee debt repayment.
Exit Proceeds Need Costs and Taxes
At the end of year five, assumed hardware proceeds are RMB 0.975 billion and facility proceeds RMB 0.595 billion, totaling RMB 1.57 billion. These are absolute exit-price assumptions, not values that automatically increase with procurement premiums.
Disposal costs at 5% are RMB 78.5 million. Initial non-facility assets are fully depreciated. Remaining facility tax basis is RMB 637.5 million, plus RMB 150 million of undepreciated maintenance assets. Total tax basis is RMB 787.5 million. Reference taxable disposal gain is RMB 704 million; tax is RMB 176 million. Net asset-sale proceeds are RMB 1.3155 billion.
Recover approximately RMB 293.5 million of working capital and release RMB 200 million of operating cash to obtain about RMB 1.8090 billion of net exit receipts. The debt has already been repaid and is not deducted again. Loss scenarios need their own tax-loss and disposal-tax calculations.
This assumes receivables are collected at face value and the assets sell in the stipulated condition. It excludes investor-level additional taxes and promptly recoverable VAT. Delayed recovery, non-recoverable taxes or bad debts change the cash flows. A continuing business cannot simultaneously release all required working capital and cash reserves. An enterprise-value exit that includes equipment cannot also add a separate sale of the same equipment.
Returns Depend on Dates, Not Just Totals
Five years of project operating free cash flow of about RMB 12.90 billion, plus exit receipts of RMB 1.81 billion, less pre-revenue funding of RMB 11.35 billion, leave nominal project gains of roughly RMB 3.36 billion. Nominal shareholder gains are about RMB 2.63 billion; the difference is financing cost net of its tax shield.
| Cash date, RMB billion | Project | Equity |
|---|---|---|
| t0, construction start | -5.400 | -5.400 |
| t1, completion and startup funding | -5.949 | -0.549 |
| t2, end of operating year 1 | 2.446 | 1.123 |
| t3, end of operating year 2 | 2.483 | 1.209 |
| t4, end of operating year 3 | 2.633 | 1.407 |
| t5, end of operating year 4 | 2.679 | 1.502 |
| t6, end of operating year 5 and exit | 4.470 | 3.341 |
IRR is the discount rate making a cash-flow sequence's net present value zero. Project and equity use their own sequences, yielding 7.2687% and 8.7387%. At the respective assumed hurdles of 10% and 12%, NPVs are negative RMB 936.66 million and negative RMB 695.83 million. The hurdles are evaluation assumptions, not universal industry standards.
Shareholders contribute RMB 5.94933 billion and receive RMB 8.58168 billion, for a holding-period ROI of 44.2461%. Dividing that ROI by five or six does not produce an annualized return. Nor does averaging scenario IRRs replace an evaluation of scenario cash flows.
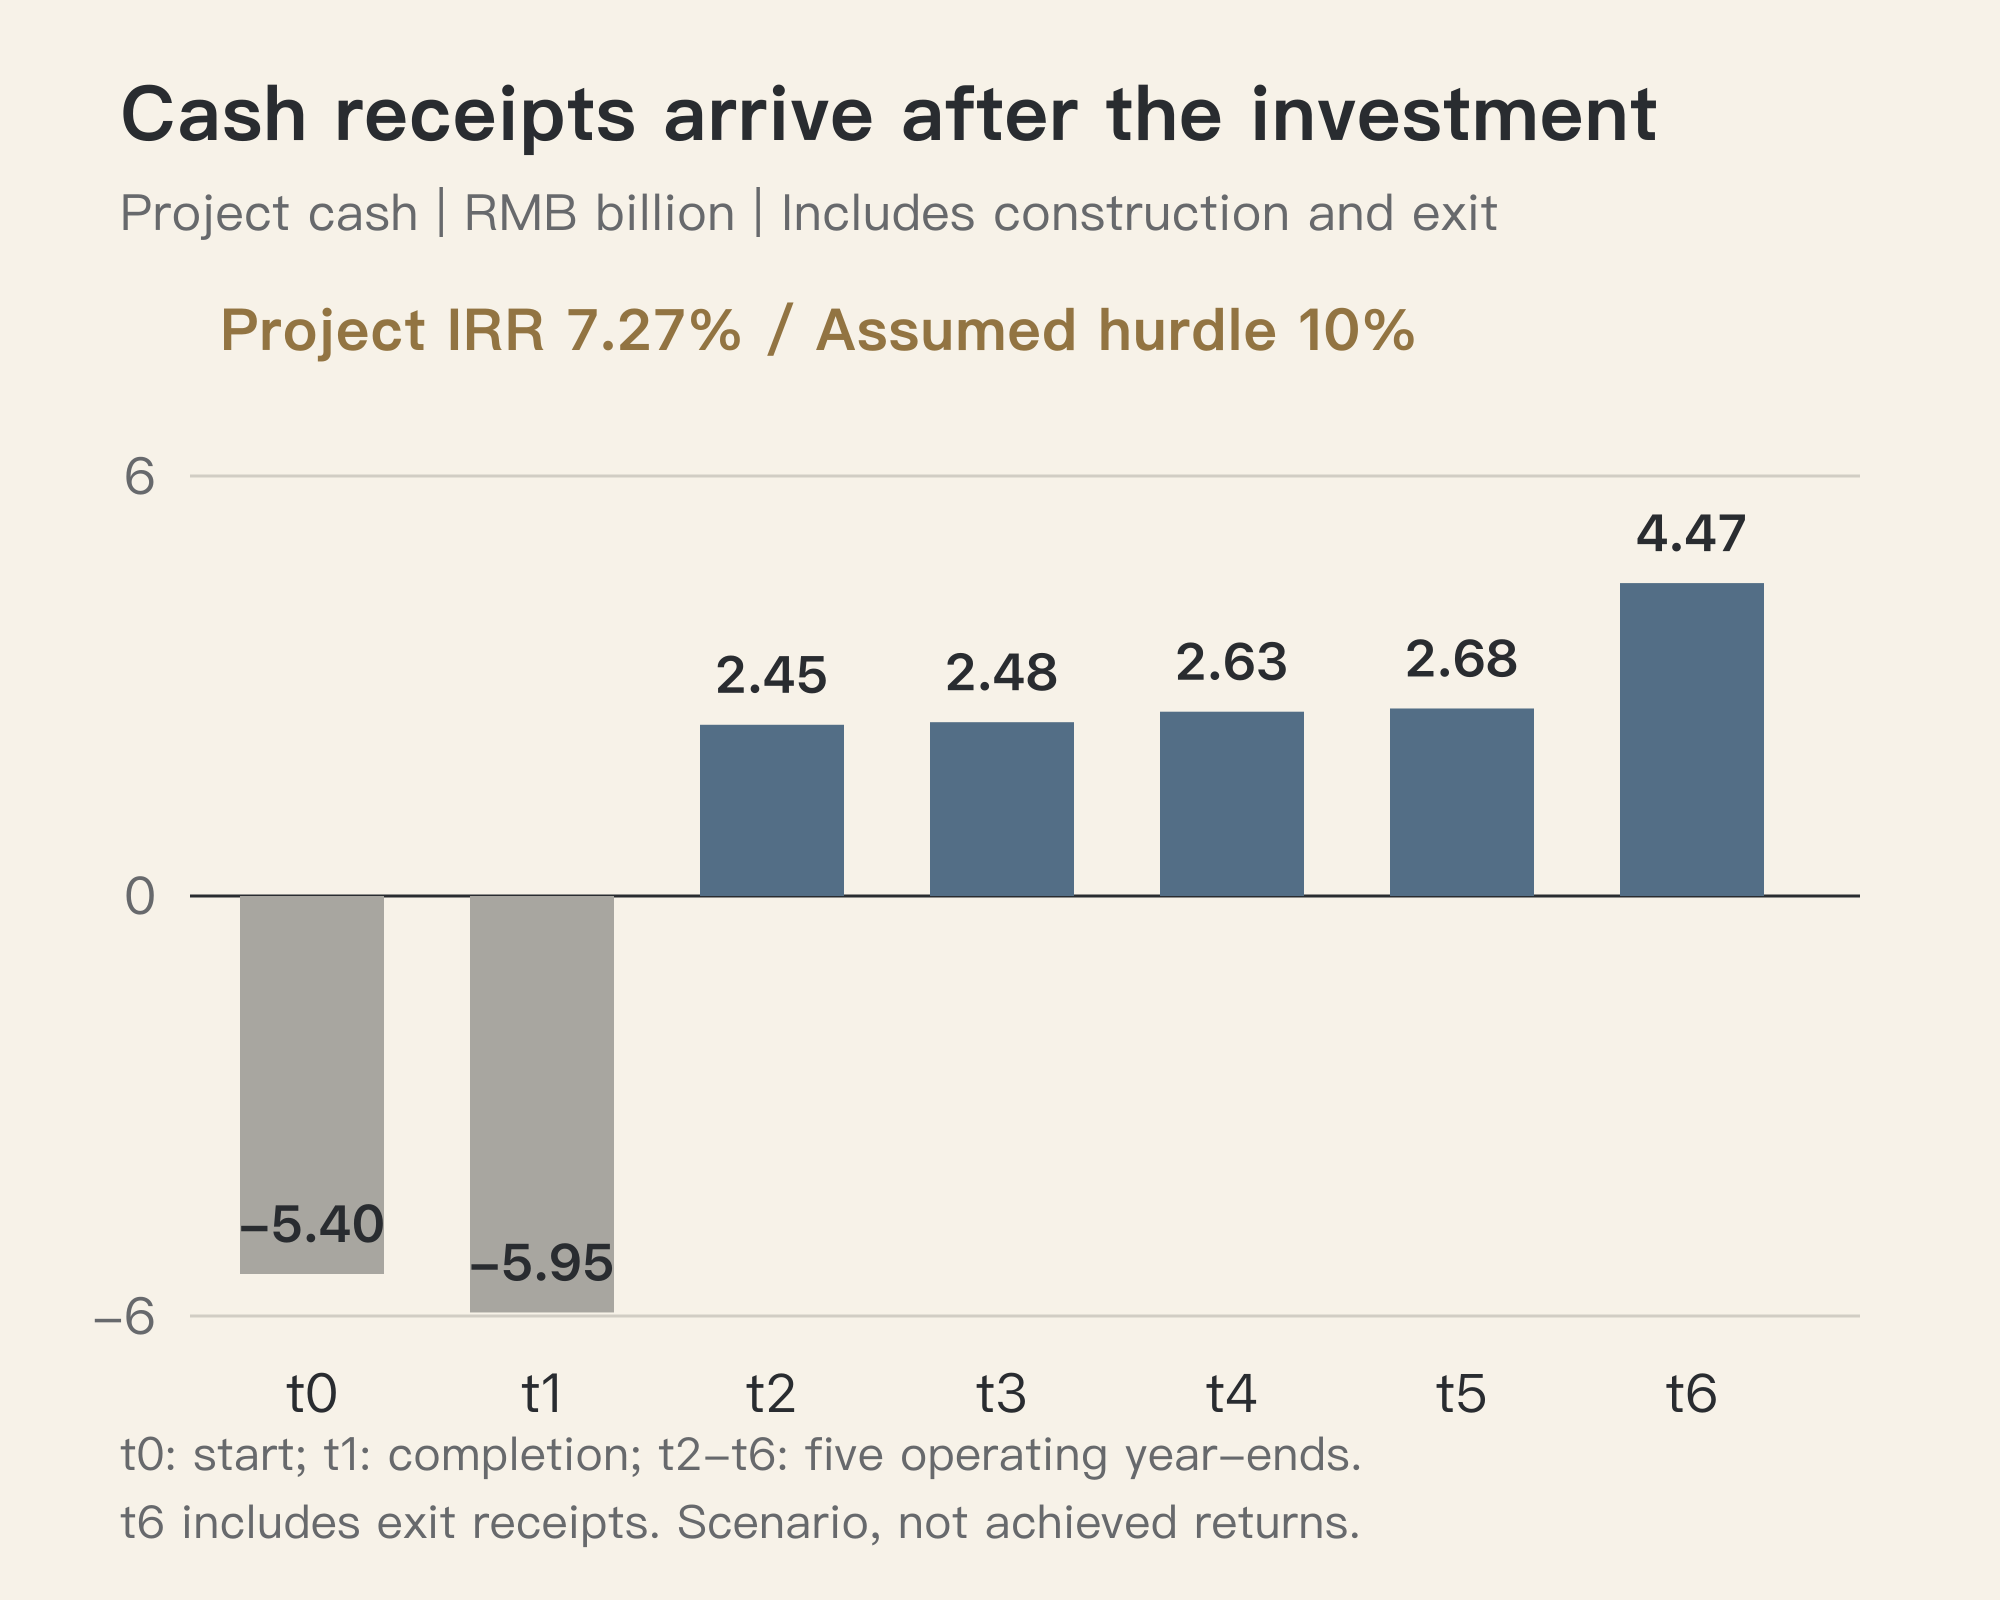
The model aggregates operating cash at year-end. Static project payback is about 4.42 operating years using within-year interpolation, or 5.42 years from construction start. With strictly year-end observations, cumulative project cash turns positive only at the end of operating year five. A formal decision should use dated monthly cash receipts and payments with XIRR and XNPV. A valuation change caused by moving dates is not an achieved operating improvement.
The Procurement Ceiling Comes From Operating Conditions
Hold the hardware configuration, delivery, customer conditions and absolute exit prices constant. Change the server purchase price and update depreciation and financing accordingly:
| Server price, RMB million | Initial CapEx, RMB billion | Funding before revenue, RMB billion | Project IRR | Equity IRR |
|---|---|---|---|---|
| 5.20 | 8.550 | 9.10 | 12.8% | 16.8% |
| 7.00 | 10.800 | 11.35 | 7.3% | 8.7% |
| 9.00 | 13.300 | 13.85 | 2.8% | 1.7% |
| 14.50 | 20.175 | 20.72 | -6.7% | -16.5% |
The high-price case needs approximately RMB 56 million of additional equity in the first operating year. That contribution is included in its return but not in the pre-revenue funding column. If a cheaper quote entails later delivery or weaker support, those parameters must change too. It is not valid simply to move down the price column.
At a 10% project hurdle, the reference case supports a maximum price of about RMB 6.0421 million per server. Changing input billing lowers it to RMB 5.3013 million or RMB 4.7088 million in the scenarios above. The answer to "what is the hardware worth?" includes customer demand and operating capability.
These are not market price targets or general buying ranges. Only a project able to secure the relevant orders, configuration and delivery conditions can use the corresponding cash flows.
Assign the Next Tests to the Parties Responsible
Investors need funding and rights: drawdown conditions, maximum commitments, additional-equity obligations, distribution restrictions and disposal rights. Operators must turn modeled demand into contracts and produce delivery and billing evidence under matching service conditions. Builders and equipment suppliers must translate budgets into defined configurations, interfaces, schedules, acceptance criteria and maintenance responsibilities.
Whole-factory returns are not the return earned by each participant. Operating fees, EPC margins and each investor's distributions need their own cash-flow calculations. If fees are already budgeted, replace those lines rather than adding them again. Internal payments between participants are not extra revenue for the factory as a whole.
Comparing owned facilities, colocation and rented compute likewise requires one common decision date, actual delivery dates, all minimum payment commitments and exit rights. Colocation does not eliminate the purchase of servers. Rented compute does not eliminate long-term obligations. The value of earlier billing must not be erased by forcing every option onto the same commissioning date.
For these reference conditions, the useful next step is bounded validation, not treating planned capacity as justified investment. Confirm major customers' billing categories and growth opportunities, obtain comparable equipment quotations, validate the key complete deployments, and then recalculate the first phase and expansion using real dates. If the evidence fails to support the assumptions, uncommitted investment must remain reducible, deferrable or cancellable.
Reproduction Appendix
Annual reference opportunity counts are 100, 225, 375, 449.6 and 500. Customer weights for Flash fast, Flash standard, GLM, Pro and K3 are 8.75%, 26.25%, 35%, 20% and 10%. Absolute output demand for each product equals its reference rate times 31,536,000 seconds, the opportunity count and its weight. This defines assumed demand; the weights are not revenue shares. Once defined, demand must not automatically increase when measured supply throughput improves.
| Product | Reference output tokens/s per server | Input/output ratio | Technical factor | Servers per complete group |
|---|---|---|---|---|
| Flash fast | 996.72332 | 142.3432 | 70% | 1 |
| Flash standard | 5,149.87724 | 169.9779 | 70% | 1 |
| GLM | 17,647/3 | 144,560/17,647 | 100% | 3 |
| Pro | 6,448.477563044 | 51,591.9838642132/6,448.477563044 | 100% | 2 |
| K3 | 564.57091 | 79,778.29726/564.57091 | 100% | 1 |
Apply the common 80% saleable-capacity factor after the technical factor. Cap output by demand, derive matching input, and apply cache categories, time-of-use pricing, delta and annual price indices. For each year, enumerate feasible integer deployments within 687 servers and maximize revenue less business-specific variable expenses. Common costs are fixed budgets here; this optimization does not establish additional energy savings.
The following full-precision cash flows are in RMB billion, ordered from t0 to t6. Extra decimals support reconciliation, not forecast precision.
Project:
-5.40000000000, -5.94932873111, 2.44605728790,
2.48301296700, 2.63281905107, 2.67876941214, 4.47001759876

Equity:
-5.40000000000, -0.54932873111, 1.12305728790,
1.20861296700, 1.40701905107, 1.50156941214, 3.34141759876
Procurement, business and financial parameters throughout are scenario assumptions. Technical inputs use the selected records available by October 11, 2026. Reproducible arithmetic does not establish customer orders, licensing, financing or on-site performance. This article discusses an investment and operating method; it is not investment advice.
Companion reading: Investing in a Token Factory: High Rental Rates Do Not Make a Good Investment, on procurement, customers and financing beyond headline rental rates.