
Summary
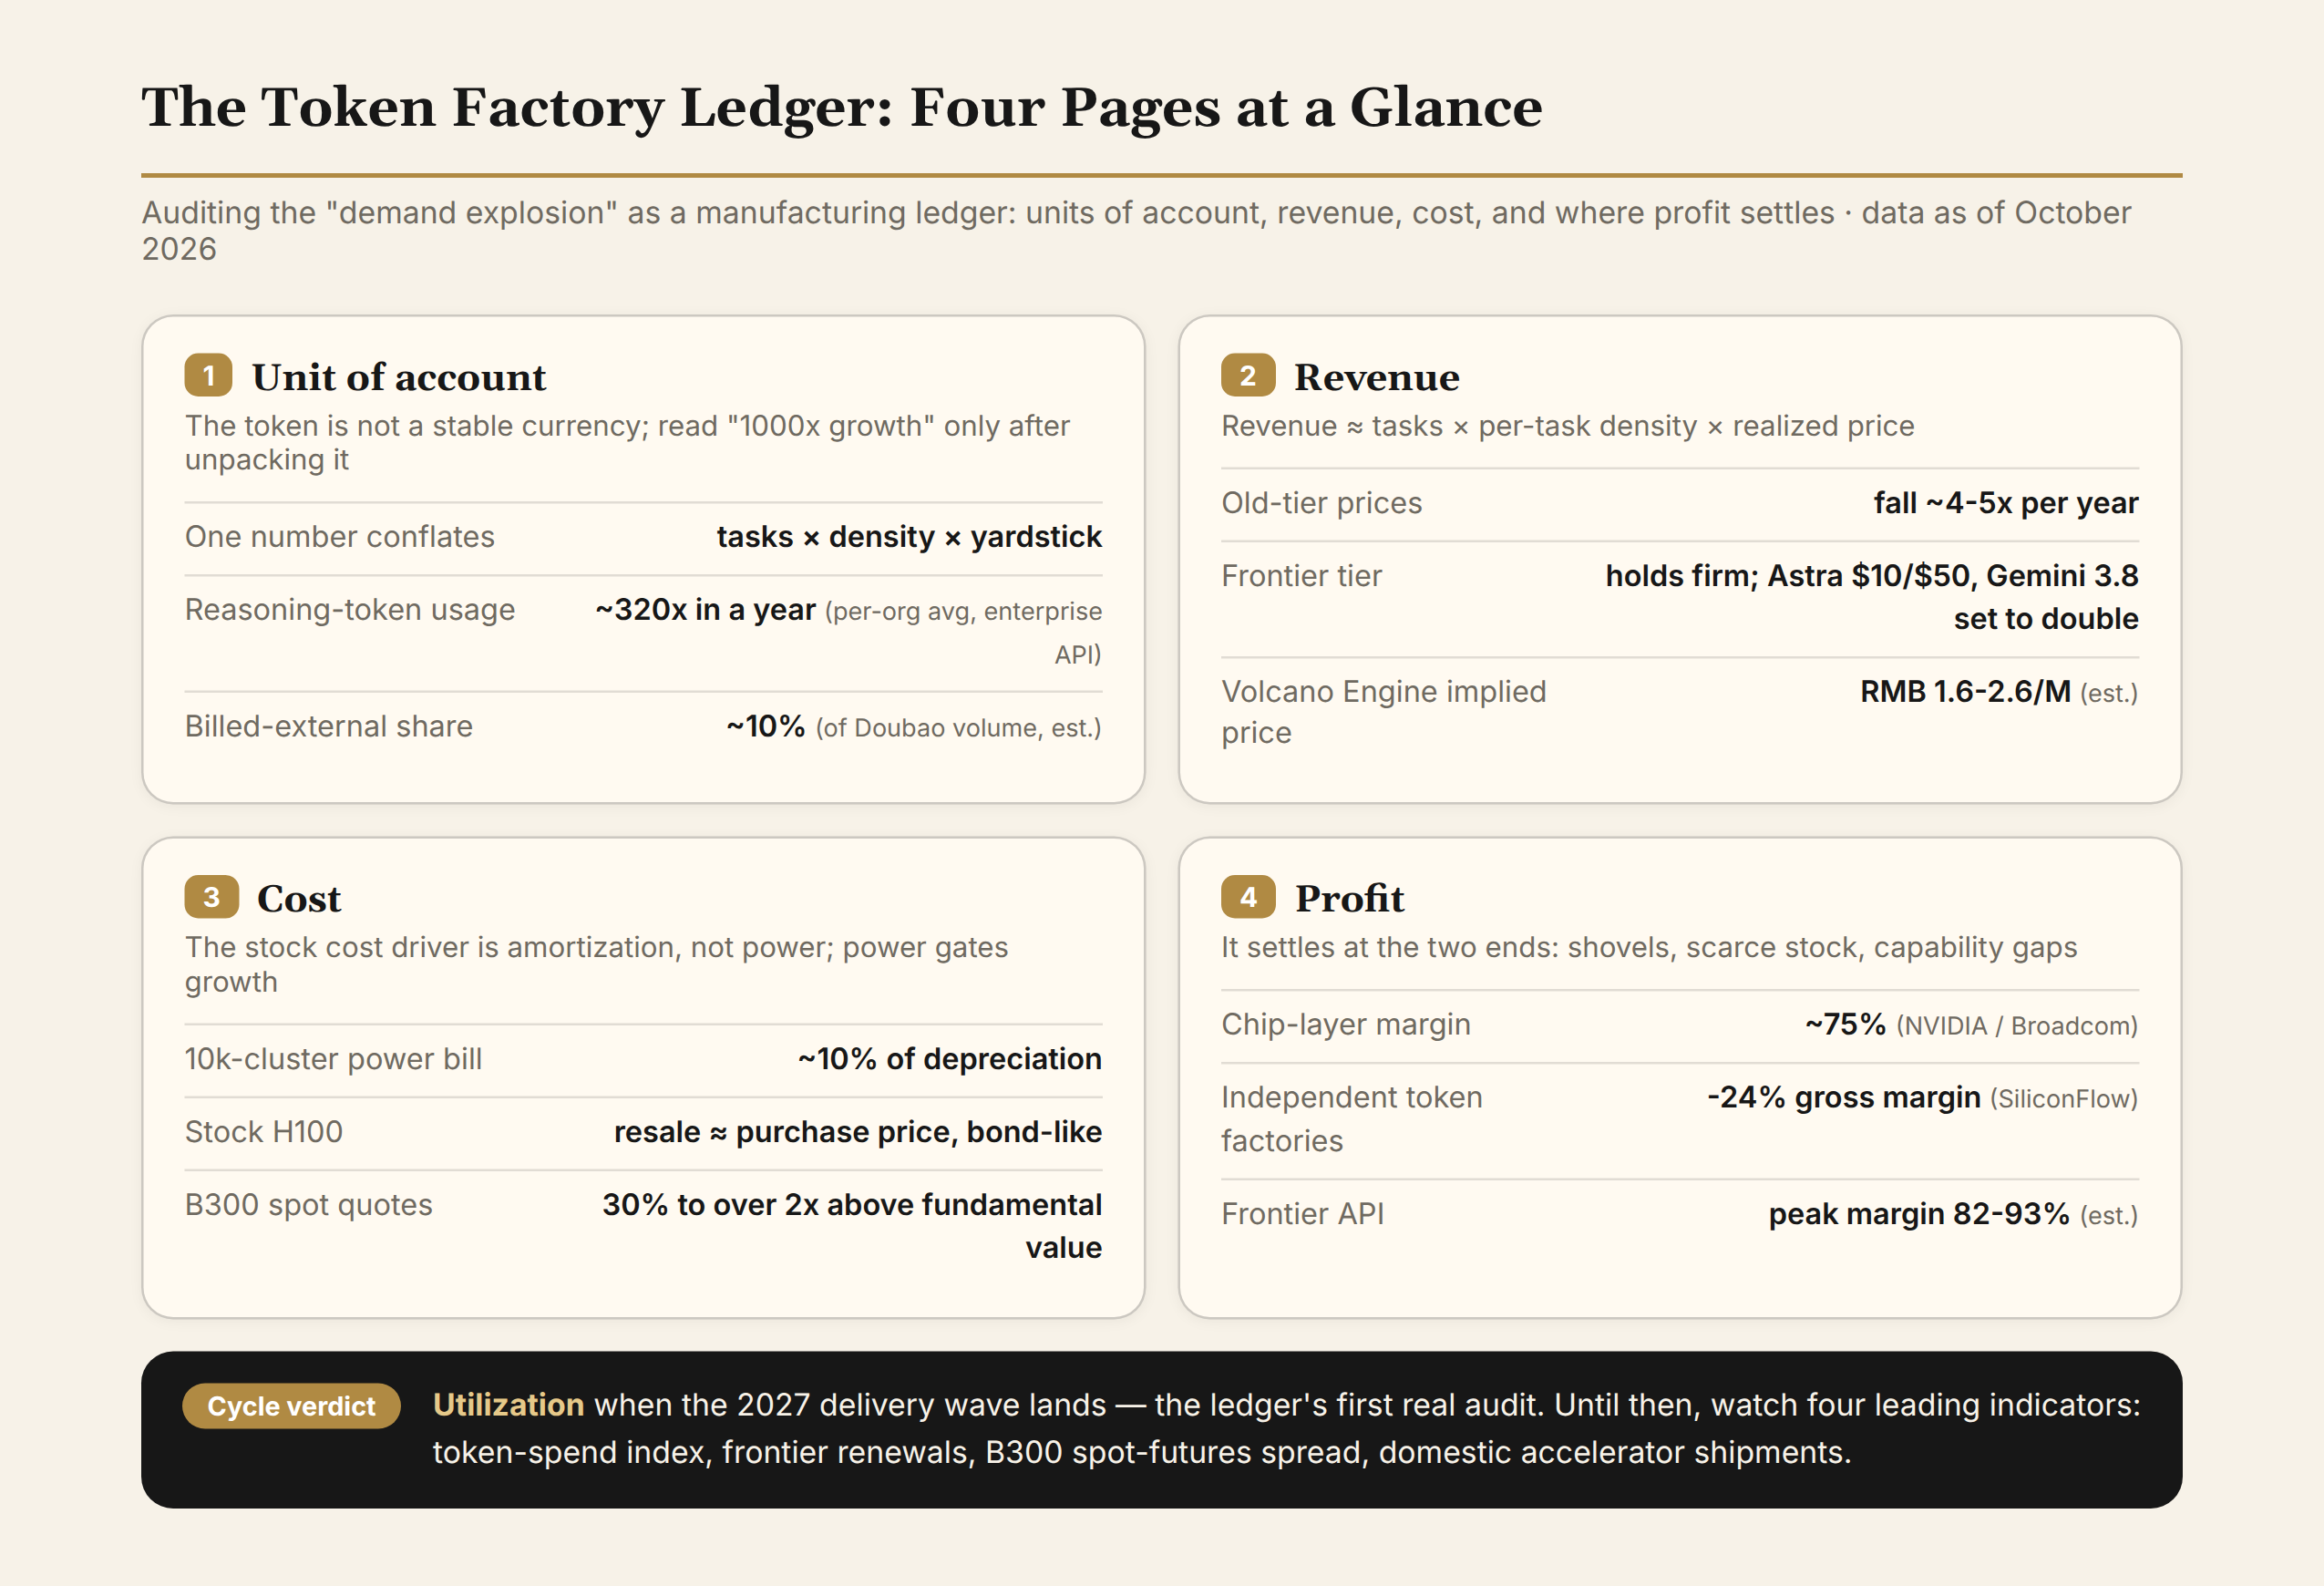
In 2026, the compute market is raising prices and cutting them at the same time, and the two are not contradictory. Compute is turning from a “construction project” into a “factory” that continuously produces a commodity called tokens. This article audits the ledger across four pages (the unit of account, revenue, cost, and profit) and lands six judgments:
- The token is not a stable unit of account. “Usage grew a thousand-fold” mixes three kinds of growth: more users and use cases, more tokens consumed per task, and changes in the yardstick. Doubao’s externally billed usage is only about a tenth of its total volume. Any “thousand-fold growth” must be unpacked and read at a discount.
- Price has two layers. Old capability tiers deflate in competition, roughly 4-5x per year; the frontier tier stays firm. DeepSeek’s August “price hike” mostly clawed back promotional subsidies, plus peak/off-peak timing; peak input still sits below the April list price. What deserves watching is how long the frontier layer can stay firm.
- Power is not the stock-cost driver; amortization is. A 10k-GPU cluster’s power bill runs about a tenth of its depreciation; power’s real role is to gate new supply. China’s high-end GPU market runs on two ledgers: stock H100s hold a resale value near their purchase price, so holders earn the spread between accounting depreciation and true depreciation; the spot quotes for incremental B300s sit 30% to over 2x above fundamental value, and buyers at the top of the market don’t make money from renting out.
- Profit settles at the two ends, and the middle is being squeezed thin. The chip layer runs ~75% gross margin; China’s independent token factories run negative (-24% for SiliconFlow). Model labs earn the “capability gap over rivals,” and that window is shrinking: GPT-4-class quality took about a year and a half to be matched; the reasoning tier took about five weeks from the formal API.
- Pricing power sits with the model labs. The same open-weight model is hosted by many vendors, yet the official price remains the anchor, and everyone else follows. Third-party token factories run a spread business (anchor price minus own cost) and control neither end.
- The biggest risk is in the financing structure. Anthropic’s compute commitments approach 10 GW; fully built out, the annual bill is in the hundred-billion-dollar class against $30B annualized revenue. The whole chain’s solvency rests on one assumption: that token revenue keeps compounding. Utilization when the 2027 delivery wave lands is the first real audit.
Two sets of facts hold simultaneously in the 2026 compute market.
One set is price increases.
- In June, the US compute platform Baseten told customers its October renewal price for B200 GPUs would rise from $2.63 to $5.10 per GPU-hour, a 94% increase.
- On August 16, DeepSeek moved its flagship V4-Pro to peak/off-peak pricing, with peak input at $1.32 per million tokens. The promo price that became the standing price in May was $0.435; against that, peak input tripled and peak output rose 355%. But two things belong in the same breath: peak input is still below the April list price of $1.74, and peak hours cover only about a fifth of the week, with everything else at half price. The official reason: use compute more efficiently and steer developers off-peak.
- On October 1, Nebius completed its second price increase of the year; B300 on-demand rose to $9.50 per GPU-hour.
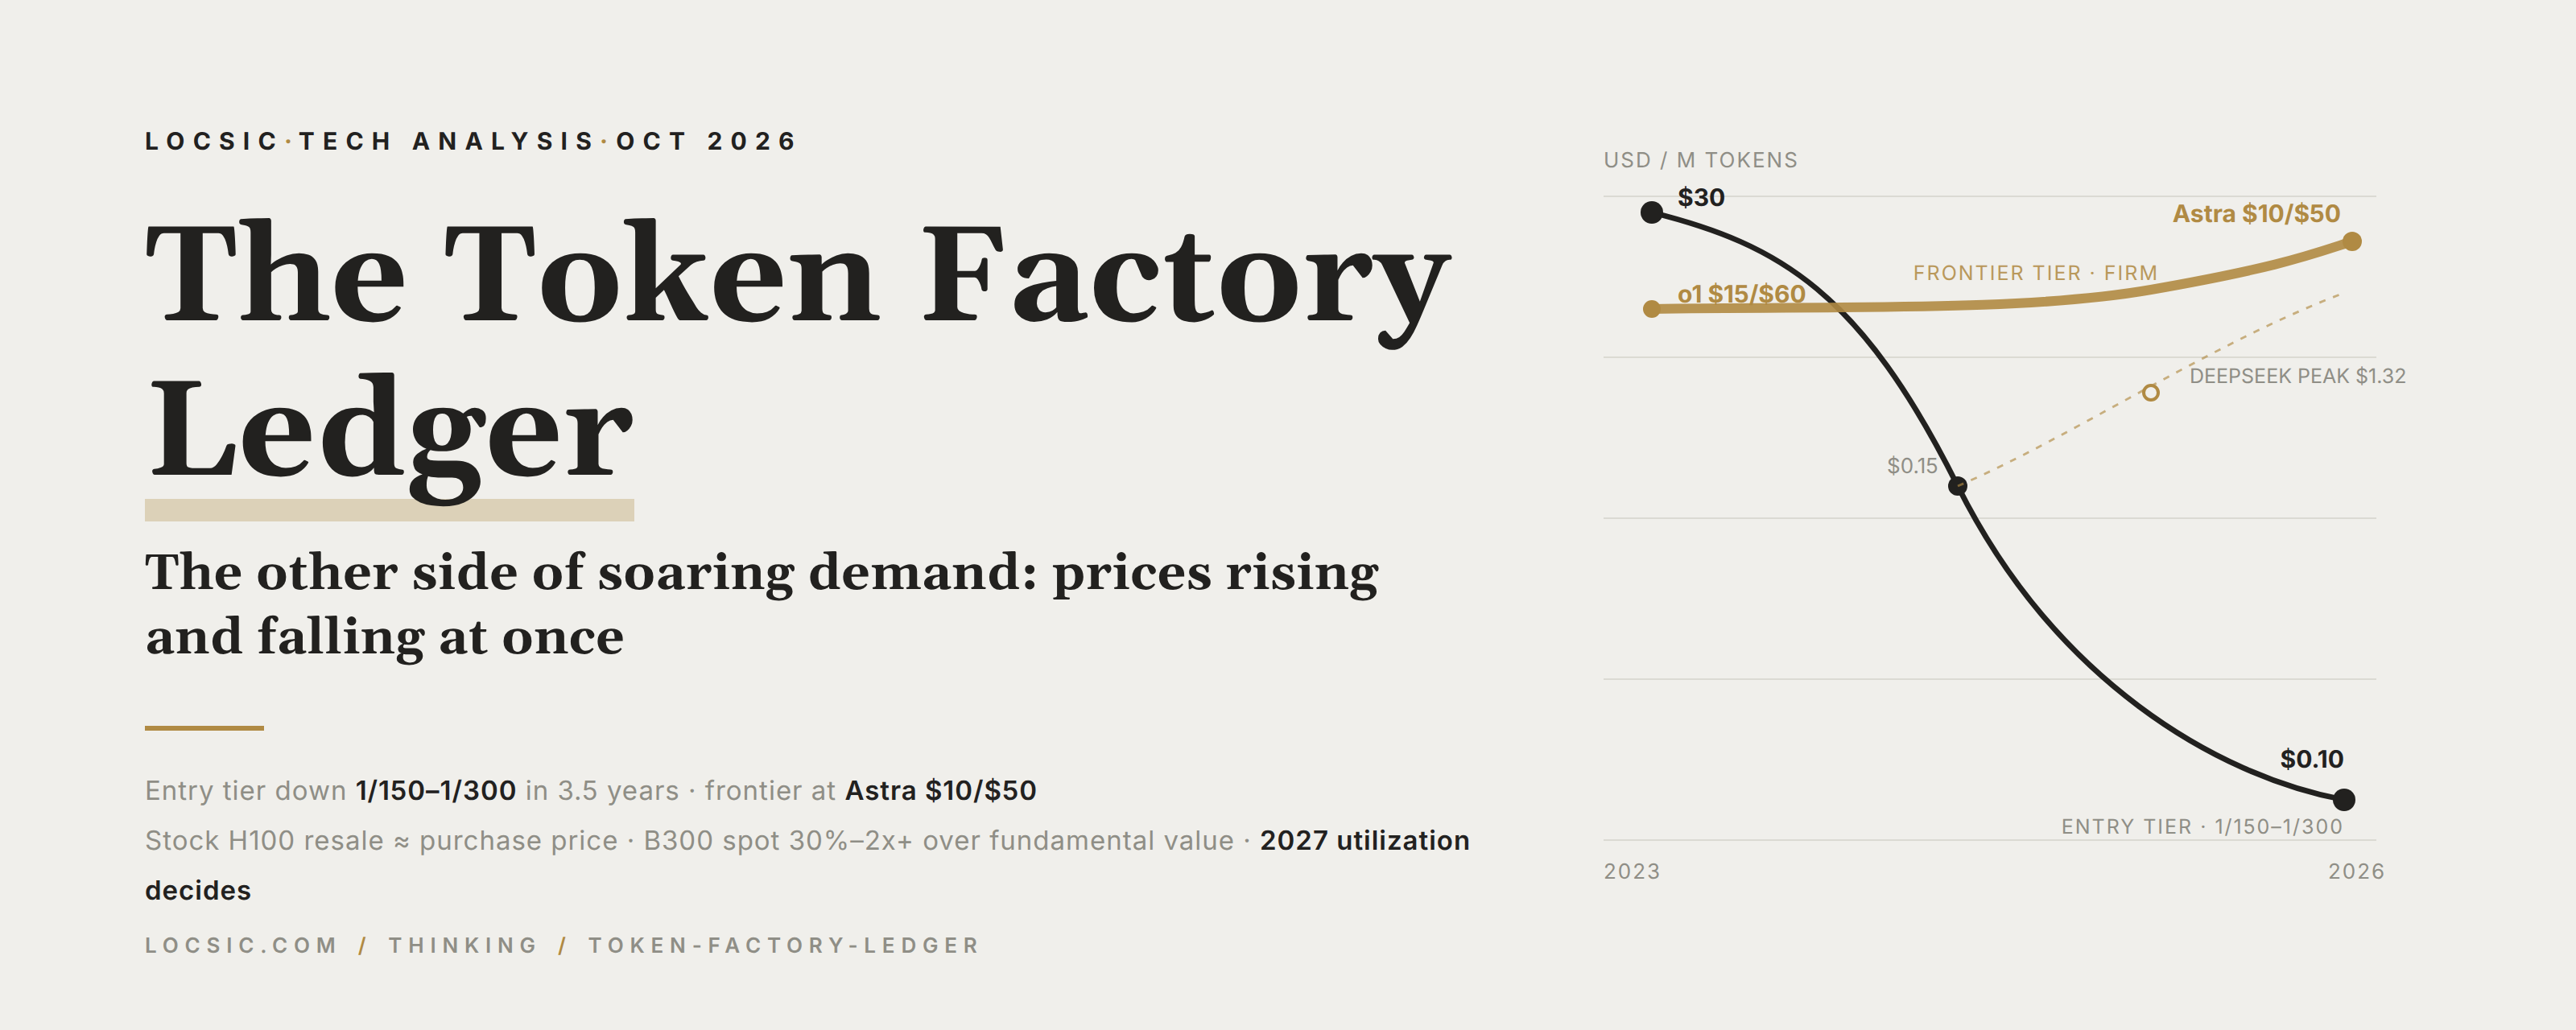
The other set is price cuts, the dominant narrative of the past two years. Doubao’s daily token usage grew 1,500x in two years; Gemini 3.1 Flash-Lite lists input at $0.10, one three-hundredth of GPT-4 in March 2023 ($30).
The two sets are two faces of the same transition. Compute is turning from a “construction project” into a “factory”: what used to be one-off procurement and concentrated training is now the continuous production of a commodity called tokens. CAICT’s 2026 report and the industry summarize the step as “the kilowatt-hour moment for intelligence services” (paraphrased). Gartner’s data points the same way: within 2026 AI-optimized IaaS spending, inference accounts for $23.3B (~55%), overtaking training’s $19B for the first time. Note this is cloud AI infrastructure spending only, not global inference spend.
If it is a factory, it has a ledger: what it keeps accounts in, where revenue comes from, how costs are amortized, and in whose hands profit settles. Work through those entries and the seemingly contradictory facts fall into place, and the variables genuinely worth watching come into view. This article works the ledger across four pages (unit of account, revenue, cost, profit) plus a fifth on the cycle.
1. The Unit of Account: The Token Is Not a Stable Currency
Before reading any “token usage up N-fold” number, ask: what does one token actually represent?
It depends on the era. OpenAI’s late-2025 enterprise report gave two numbers:
- Enterprise ChatGPT message volume (a total) grew 8x over twelve months;
- API-side reasoning-token consumption per organization grew about 320x.
The two cannot be taken as a direct ratio. One is a product total, the other a per-organization average; and reasoning models only launched in September 2024, from a near-zero base. So 320x is first and foremost evidence of how fast reasoning models spread.
Rising per-task density needs different evidence:
- Third-party testing by Artificial Analysis found that Gemini 2.5 Flash with reasoning enabled consumes about 17x the tokens of the previous-generation Gemini 2.0 Flash (non-reasoning) on the same task;
- Multimodality adds another layer: by Volcano Engine’s official numbers, Seedance 2.0 burns over a million tokens for one minute of 720p video;
- A complex agent task routinely consumes hundreds of thousands of tokens.
So “usage grew a thousand-fold” mixes three kinds of growth:
- More users and use cases, which is real volume;
- More tokens per task, which is density;
- A new-generation tokenizer changed the yardstick, an accounting artifact. Its direction is not fixed: new tokenizers are usually more economical, which would understate reported volume.
The first two are real growth; the third is a measurement issue, but all three land in the same number.
The measurement problem is not academic. In March 2026, the National Data Administration reported national daily token usage above 140 trillion; the same month, Volcano Engine reported Doubao at 120 trillion daily. The two official numbers barely reconcile: on identical definitions, Doubao alone would be 86% of the national total, which doesn’t fit its roughly half share of public-cloud MaaS. The definitions must differ (video tokens, intra-group usage, billed-only or not), but nobody has said which. The industry is keeping books in a currency that inflates, with every house using its own scale.
The standard fix is a “fixed task basket”: pick a set of fixed tasks (a thousand-word summary, a code fix, a minute of video) and track across generations how many tokens and how much money each costs: a CPI for tokens. No institution publishes such data continuously yet. For now, indirect evidence fixes the direction: ~17x per request, a million-plus tokens per video minute, hundreds of thousands per agent task; within a single model generation, density is stepping up. Cross-generation density inflation as a direction holds; the magnitude cannot be pinned down.
Every “volume” number in the rest of this article should be read against that backdrop: they count tokens, not tasks.
2. Revenue: Unpacking the “Surge” into Three Factors
A token factory’s revenue can be written as:
Revenue ≈ task volume × per-task token density × realized price
The yardstick shifts from Section 1 sneak into “density.” The three factors point differently: volume and density are rising, price is falling. So revenue growing more slowly than token usage should be the norm. Plug in the numbers to check, with one exception to come.
Volume: the sturdiest factor
Volume has continuous official series:
- Doubao daily tokens: 120B at launch in May 2024; 63T in December 2025; 120T in March 2026; past 180T by June. 1,500x in two years, still over 10x in the past year.
- Google all-products monthly tokens: 9.7T in May 2024; 480T in May 2025; 3.2 quadrillion in May 2026: 330x in two years.
IDC offers another lens: 2025 China public-cloud LLM usage totaled 1,944T tokens, up 16x year over year, about 5.3T per day. That’s more than ten times lower than Doubao’s own reported 63T daily the same month. The sensible reading: IDC counts externally billed public-cloud usage, while Doubao’s number includes intra-group consumption (the composition is this article’s inference). Both are real; they are not directly comparable, the yardstick problem again.
Enterprise-side numbers are equally steep: Google Cloud has 375 customers consuming over a trillion tokens a year each; on Volcano Engine’s platform, enterprises using over a trillion tokens a year doubled from 100 to 200 within half a year.
Price: the most informative factor
Price is not one line but a family of curves layered by capability tier: current flagship, previous flagship, light tier. Within a tier, capability is comparable regardless of vendor, and each tier has its own price history.
DeepSeek’s official pricing history tells the story best: over two years it has been both the price cutter and the price raiser.
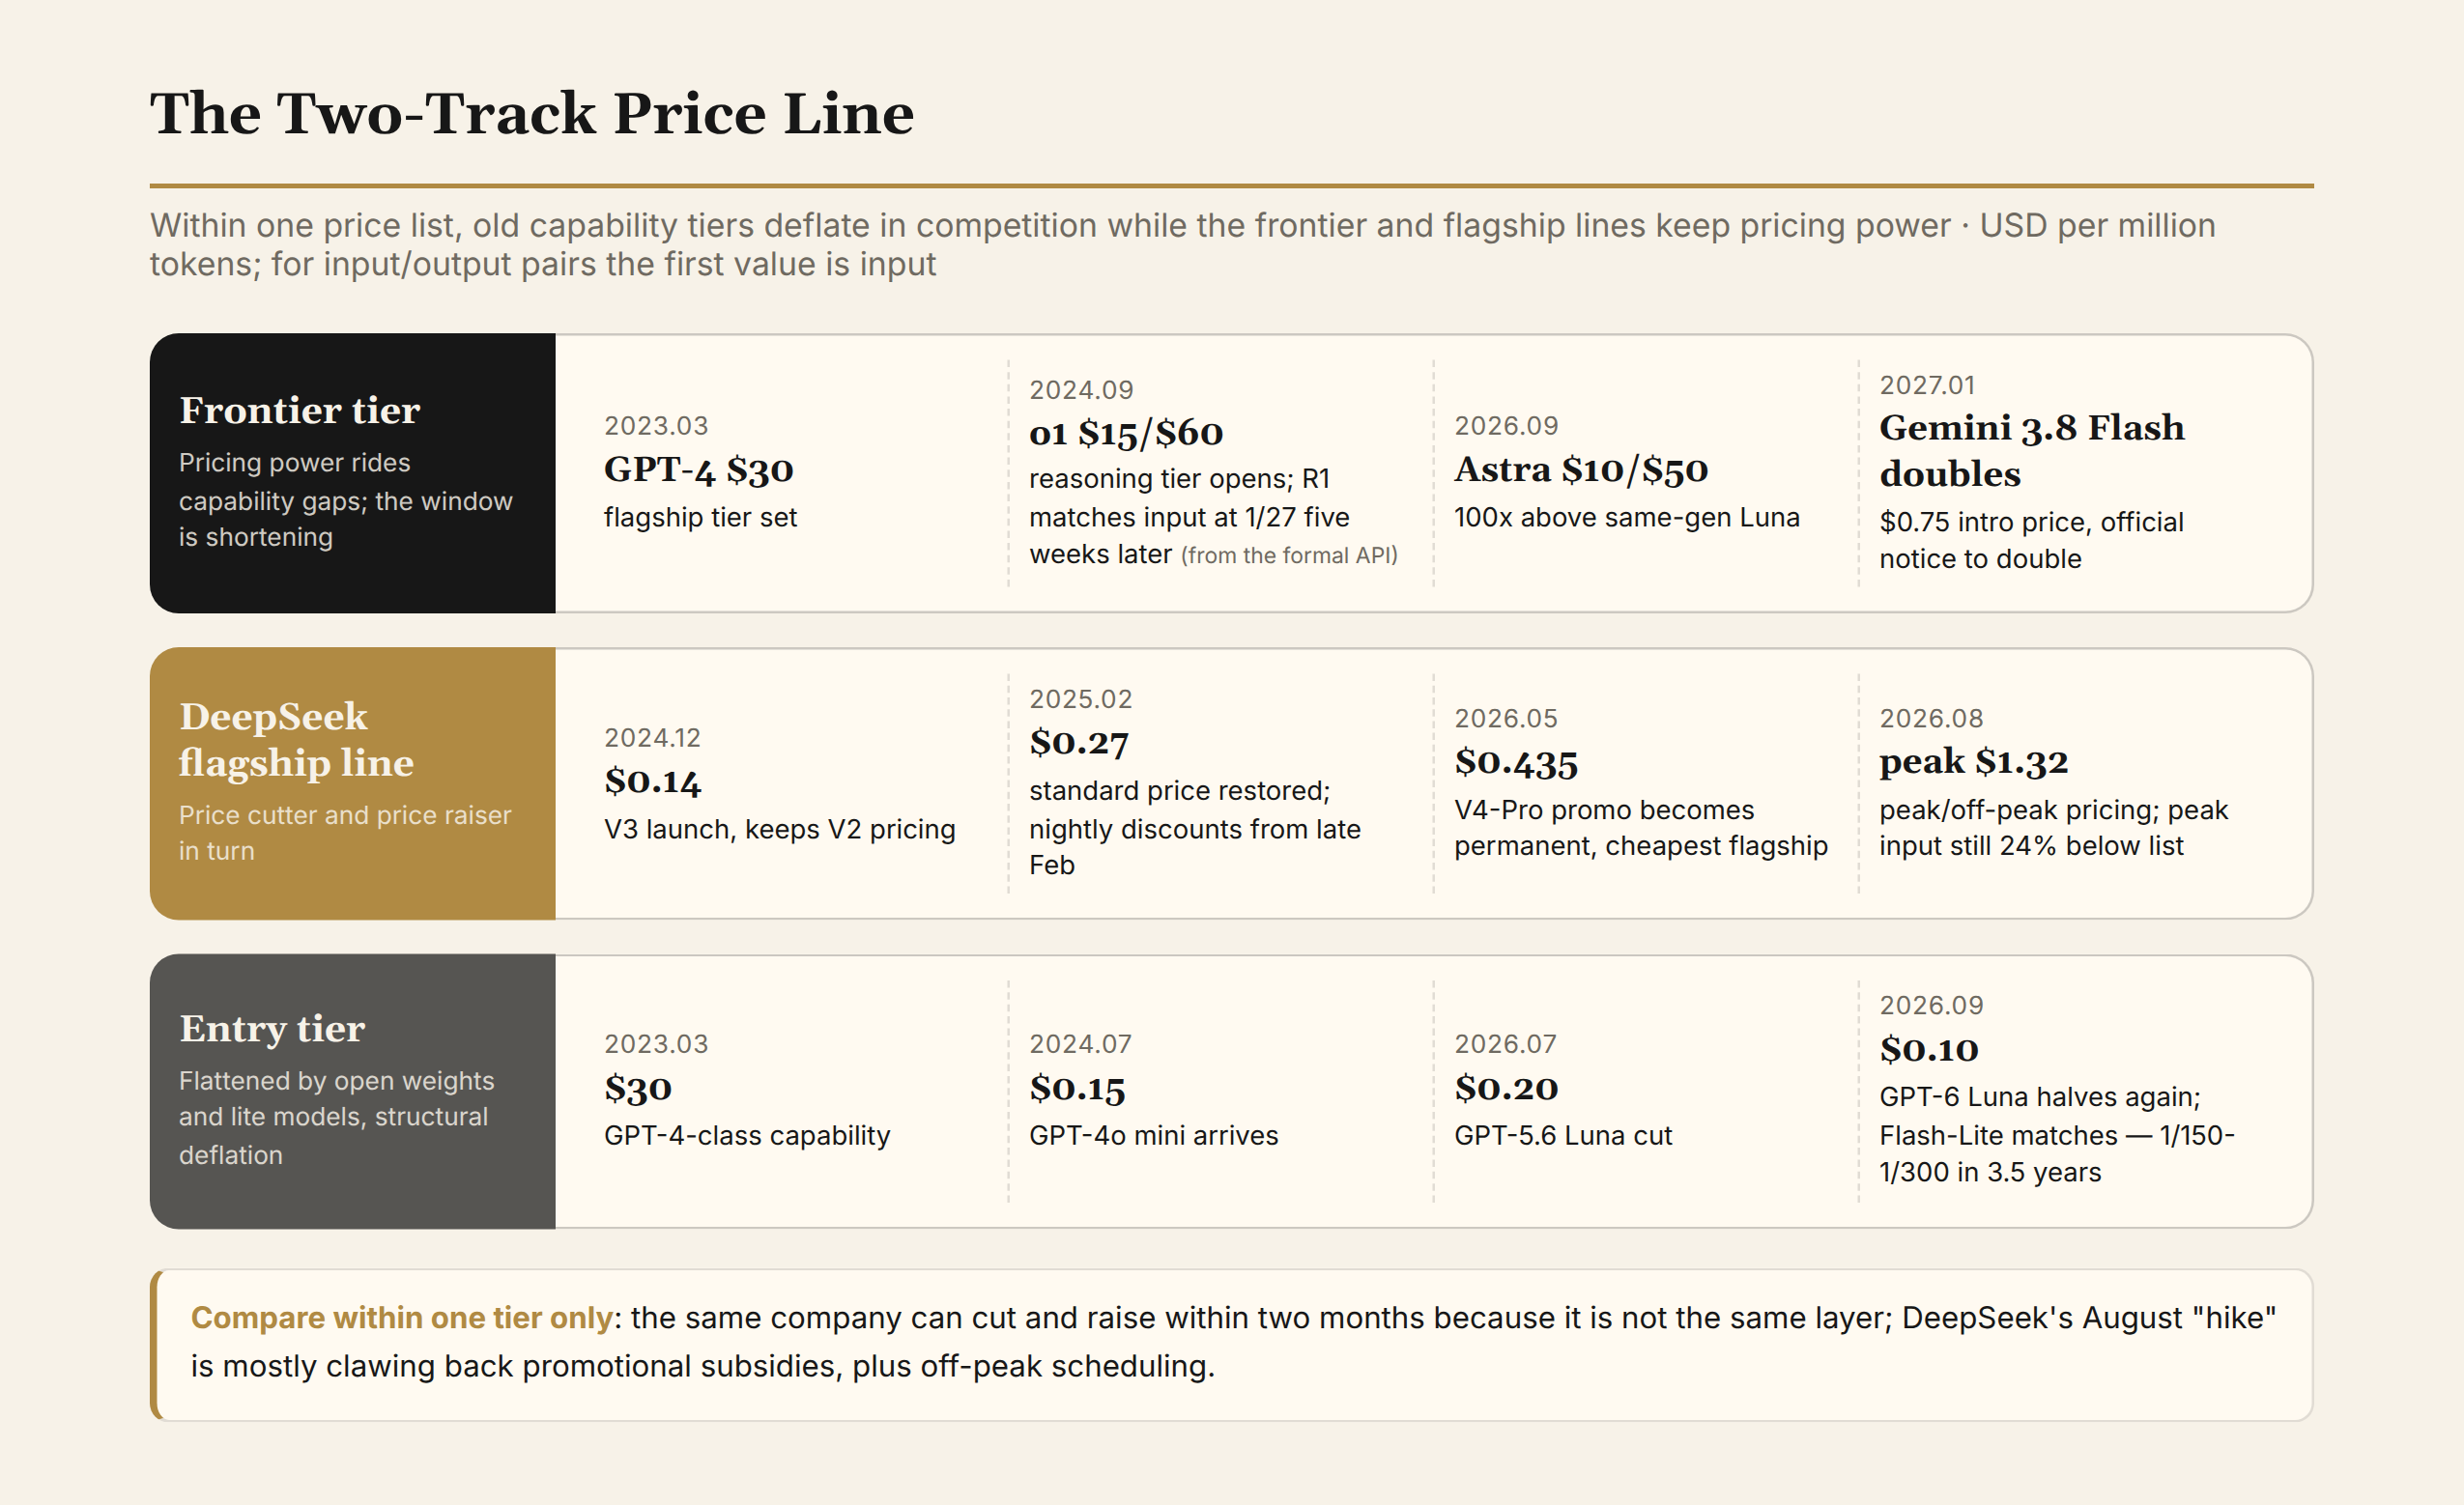
- December 2024: V3 launches, keeping V2 pricing: input $0.14 per million. From February 8, 2025, the standard $0.27 is restored, an order of magnitude below same-tier US models. Late that month, nightly discounts arrive for V3/R1; time-of-day pricing dates from there.
- April 24, 2026: V4 ships. Pro lists at $1.74/$3.48; Flash at $0.14/$0.28. Pro carries a 75% launch discount, input at $0.435, plus cache-hit prices.
- May 22: the discount becomes the standing price (Pro input $0.435, output $0.87), the cheapest flagship in the world.
- August: the 6th brings notice of an increase; the 13th, alongside V4-Pro-0813’s release, new prices; the 16th, peak/off-peak takes effect. Peak windows are UTC 01:00-04:00 and 06:00-10:00 (Beijing weekday 9-12 and 14-18), weekdays only, about 21% of the week; everything else at half price.
The August adjustment needs three baselines:
| Window | New price (input/output, $/M) | vs. May standing | vs. April list |
|---|---|---|---|
| Peak | 1.32/3.96 | ~3.6x blended at 3:1 | input down 24%, output up 14% |
| Off-peak | 0.66/1.98 | ~1.8x blended | both below list |
So the “hike” is mostly clawing back promotional subsidy, plus congestion scheduling by time of day.
China has an earlier price line: in May 2024, Doubao entered at RMB 0.8/M input (officially 99.3% below the industry average). Within a month, Alibaba cut Qwen-Long by 97% and Baidu went free.
The US tier shows both ends of the same law:
- Bottom: on July 30, OpenAI cut GPT-5.6 Luna to $0.20/M; by late September, GPT-6 Luna halved again to $0.10. Benchmarked against GPT-4-class quality, the entry price fell to 1/150-1/300 of the original over three and a half years, the two ends corresponding to $0.20 and $0.10. Annualized over 3.5 years, that’s about 4-5x per year; shrink the window to three years and it approaches 6x. The benchmark and window choices matter a lot to this number.
- Frontier: GPT-6 Astra listed in September at $10/$50; Gemini 3.8 Flash entered at a $0.75 introductory price, with an official notice to double at New Year 2027.
Seen together, “token price” has two layers: old capability tiers deflate in competition; new tiers have room for premium under tight supply. The same company can cut and raise within two months because it isn’t the same layer. DeepSeek’s case adds a nuance: some “price hikes” are just subsidies being walked back toward list.
Revenue: read the companies’ own books
- OpenAI: annualized revenue $10B in June 2025, ~$20B at year-end, over $40B by August 2026. September press reports of “approaching $70B” were walked back by correcting coverage in early October; this article anchors on August.
- Anthropic: from $9B at the end of 2025 to $30B officially disclosed in April 2026: 3.3x in four months.
- Alibaba Cloud: AI-related product revenue posted its twelfth consecutive quarter of triple-digit growth in the June 2026 quarter, at RMB 12.4B for the quarter. The annualized revenue guide for “AI models and applications” was raised from RMB 8B to RMB 30B within the year (the correspondence with “AI-related products” revenue has not been disclosed).
Lay the revenue curves against the token-volume curves:
- OpenAI: ~4x in about 14 months, flatter than Google’s ~6.7x annual token growth, as the three-factor decomposition predicts.
- Alibaba: likewise tracks the prediction.
- Anthropic is the exception: 3.3x in four months, over 30x annualized, steeper than any published token curve. Only two explanations: its own token volume grows even faster (the coding-agent density effect), or its realized price is rising (revenue mix tilting toward the frontier tier and enterprise subscriptions). Either way, the point stands: the greatest revenue elasticity sits in the frontier layer.
A consistency check on Volcano Engine’s MaaS revenue
Volcano Engine discloses no absolute MaaS revenue, but IDC’s externally billed usage supports a consistency estimate (this article’s estimate, not official):
The 2025 base
- IDC puts 2025 national public-cloud externally billed usage at 1,944T tokens (the composition of “externally billed” is this article’s inference). Volcano holds 49.5% by volume (Tan Dai’s own words: “one in every two tokens”), about 960T for the year.
- Against Doubao’s own volume: annualizing December’s 63T daily, the externally billed share is under 5%; on the full-year average, around a tenth. A large share of usage is intra-group or unbilled.
The 2026 estimate
- Assume externally billed volume grows about tenfold in 2026 (2025’s national growth was 16x; this assumes a slowdown): Volcano’s external usage ~9.6 quadrillion tokens.
- If MaaS revenue lands at RMB 15-25B (the band implied by management’s “fivefold” target), the implied realized price is about RMB 1.6-2.6 per million.
Against list prices
- Input prices only: about 30-40% of the flagship tier (Doubao 2.1 Pro input RMB 6) and 50-90% of the volume tier (Turbo at RMB 3).
- Against the 3:1 blended list price (Pro ~RMB 12), only 10-20%.
That means actual usage skews to light tiers and cache hits, with deep enterprise discounts; “mostly running on the flagship tier” is not tenable.
Back out 2025
- A revenue base of RMB 3-5B over 960T tokens implies an average price of RMB 3-5.
- Note: “price roughly halves” is derived directly from the two assumptions (volume up tenfold, revenue up fivefold) and is not an independent verification. What can be checked is only whether a halved average price is consistent with list-price cuts and cache penetration over the same period. So far, it is.
- Also, “fivefold” can mean ×5 or ×6; the top of the band moves accordingly.
This page’s conclusion: demand is exploding, but the explosion is task volume and density stacked together, and the bulk is internal consumption, of which revenue captures only a part. On the price curve, what deserves watching is not the bottom falling (that’s structural deflation already underway) but how long the frontier layer stays firm. It determines whether model companies can keep converting added density into added revenue. Anthropic’s curve shows it can be done.
3. Cost: Tokens per Watt, the Two-Track Market, and the Depreciation Mismatch
A token’s unit cost can be written as:
Unit cost ≈ power price ÷ (tokens produced per watt × utilization) + capital amortization + engineering cost
The “engineering cost” term means the engineering that turns hardware into throughput: inference kernels, batch scheduling. Of the variables, amortization is the most counterintuitive; power is the most often misstated.
Power: an incremental constraint, not the stock-cost driver
At the 2026 AI Infra Summit, NVIDIA formally switched the industry KPI to “tokens produced per megawatt.” Its technical blog’s number: power runs up to 40% of AI-factory OpEx. That gets read as “power is the biggest cost,” but OpEx excludes depreciation, and chips are capex.
Run the arithmetic yourself:
- US: an 8-GPU H100 machine draws ~10 kW; US industrial power at 8.7¢/kWh is about $0.87 per hour at full load. The eight cards rent for $22.8-36 per hour combined; power is 2-4% of the machine’s rent.
- China: same structure. An H100’s power runs ~RMB 4,300/month against RMB 67,000 rent, about 6%.
- A 10k-GPU cluster (~1,250 machines): at PUE 1.0-1.3, roughly 110-140M kWh and RMB 45-85M in power per year (at RMB 0.4-0.6/kWh). The same cluster’s five-year straight-line depreciation is RMB 530-580M a year; power is about a tenth of depreciation (8-16%).
“Power is 40% of OpEx” and “power is a small slice of total cost” are both true; mixing them yields absurd conclusions. Power’s real role is not in the stock of cost but in gating the increment: new capacity can’t get power, which is why “tokens per megawatt” became the industry’s yardstick.
Amortization: two very different ledgers
The real stock-cost driver is amortization. In China’s 2026 market, amortization staged its most dramatic act: high-end GPUs run two entirely different books.
The stock ledger: H100
- An 8-GPU H100 bought in 2023-2024 cost about RMB 2.1-2.3M. There are contract anchors independent of second-hand prices: in September 2023, Lianhua Keji announced a purchase of 330 H800 8-GPU machines from H3C for RMB 693M, exactly RMB 2.10M each; China Telecom’s concurrent AI-server tender (4,175 training servers, RMB 8.463B) averages ~RMB 2.03M per unit (public notice, transcribed via Zhidx); gray-market H100s ran ~RMB 280k per card, implying ~RMB 2.35-2.4M per machine, corroborated by second-hand reports.
- Five-year straight-line depreciation is RMB 35-38k/month; with power and ops, full cost is about RMB 44-47k/month. That matches industry experts’ “at RMB 40k monthly rent, an H100 is near break-even.”
- Yet since May 2026 its rent has been RMB 67-68k/month, still rising after the National Day holiday.
- And the residual: a nearly three-year-old machine still trades around RMB 2.1M, essentially at purchase price. An asset depreciating RMB 37k/month on the books barely depreciates economically.
Scarcity created by export controls has turned the stock of H-series into bond-like assets. Stock holders’ profit comes from the gap between accounting depreciation and true depreciation, not operating efficiency.
The incremental ledger: B300
Price path:
| Time | 8-GPU B300, domestic price | vs. US equivalent (~$550k, ~RMB 3.9M) |
|---|---|---|
| End of 2025 | ~RMB 4.0M | roughly at parity |
| May 2026 | ~RMB 7.0M transacted | ~1.8x |
| June-August 2026 | RMB 13-14.5M high channel quotes | 3.3-3.7x |
The June-August numbers are verbal quotes on fully-specced spot units; actual transaction volumes cannot be verified.
Three fundamental-value anchors:
- Channel cost line: bill-of-materials teardown ~RMB 9.1M (RMB 7.0M transshipment plus a 30% risk premium).
- Lease-implied line: at a large-customer long-term rent ceiling of RMB 200k/month, buyers can only support RMB 9.0-9.9M, an implied 6-10% required return.
- Throughput-implied line: at 70% load, five-year amortization, priced off light-tier token rates, only RMB 6.13-8.76M. This shares its throughput assumptions with Section 4’s serving-cost estimate; the two are not independent checks.
Where’s the premium: spot quotes sit 30-60% above the lease-implied and channel-cost lines, and 50% to over 2x above the throughput line. The difference prices channel risk, default mechanics, and scarcity panic. Default penalties run only 5-10%; in a rising market, walking away and reselling is rational for the seller; the contract machinery itself pushes quotes up.
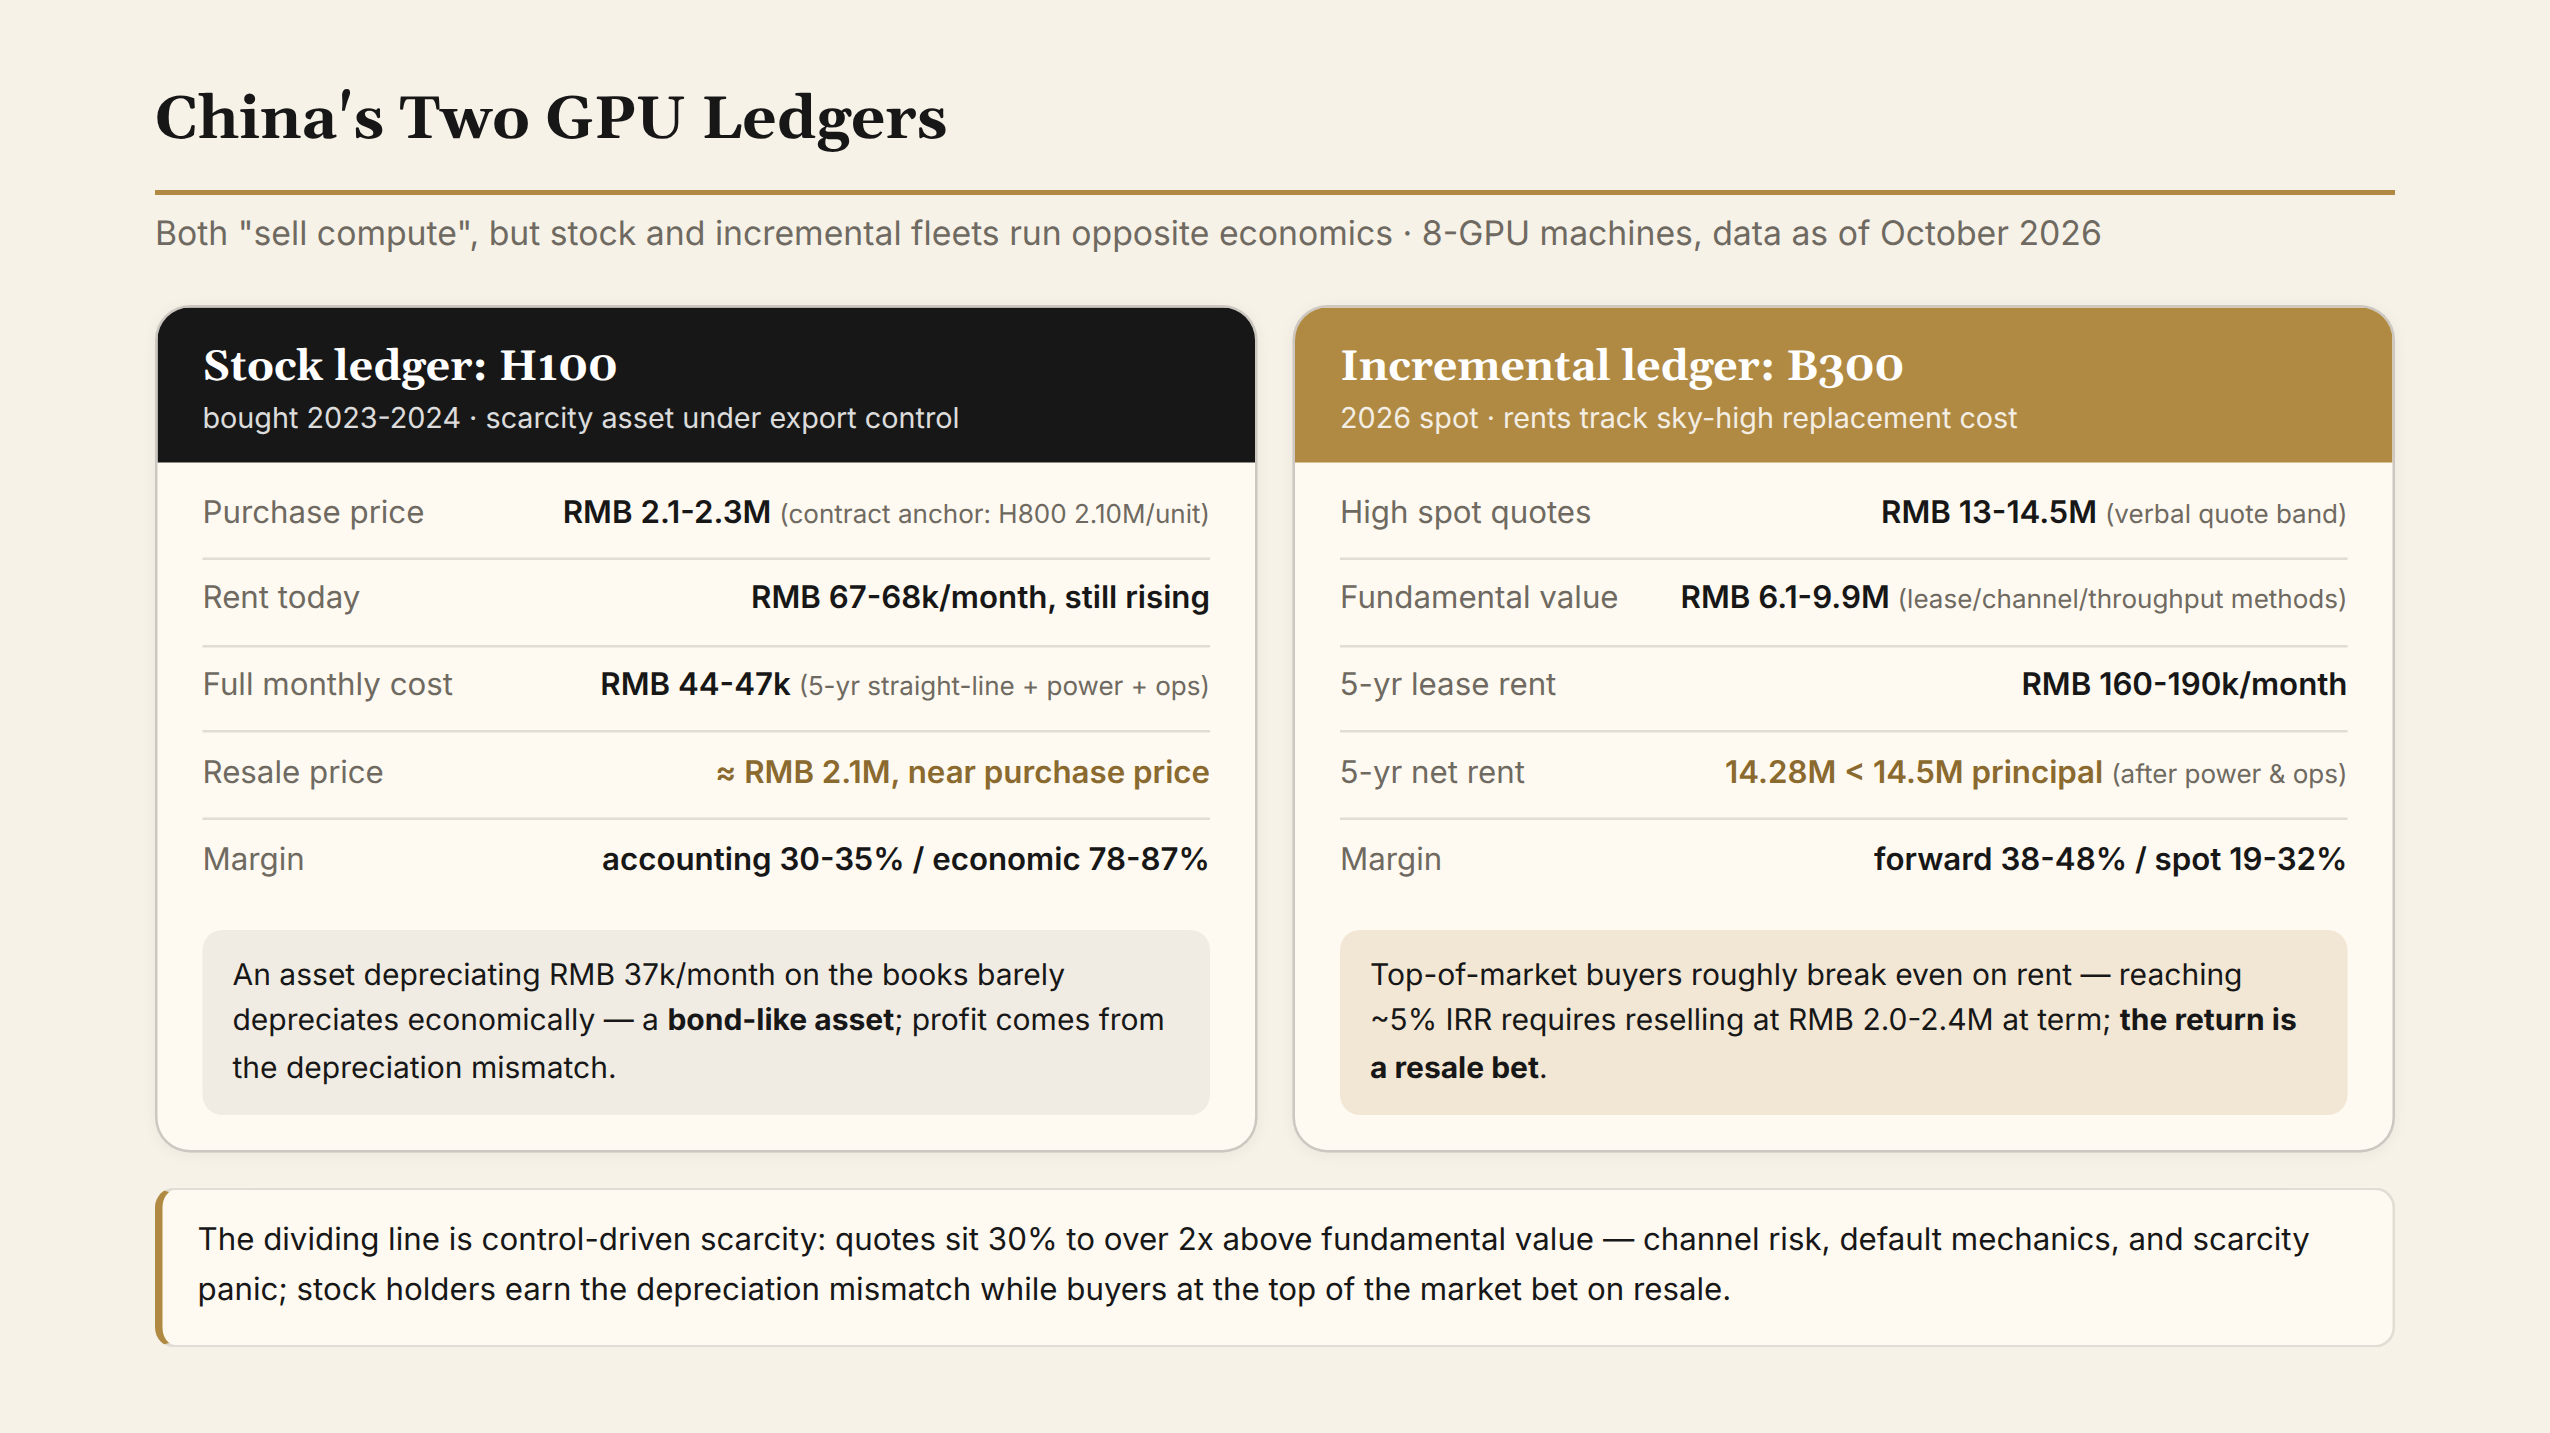
How do you earn it back? Incremental buyers must lock rent with five-year leases (RMB 160-190k/month). What follows is this article’s estimate: monthly cash-flow discounting, fully leased, zero residual, ignoring vacancy, tax, and financing, all of which would lower returns further.
| Purchase basis | Annualized IRR |
|---|---|
| Forward-locked (~RMB 5.2M) | ~26-38% |
| Spot (RMB 7.0M) | ~10-20% |
| High spot entry (RMB 14.5M at RMB 250k rent) | ~-1% to +1% |
The last row needs explaining: five years of rent net of power and ops is ~RMB 14.28M, less than the RMB 14.5M principal. Renting out doesn’t make money. To reach ~5% annualized, you must assume the machine still resells at RMB 2.0-2.4M at term. The return is a resale bet.
Put the two ledgers together and the rent contrast explains itself.
“Expensive hardware, rent at parity” happens only on the B300: gray-market machines cost 1.8x (May transacted) to well over 2x (high quotes) the US equivalent, yet per-compute rent already approaches standardized US prices, because incremental rent hugs the sky-high spot cost.
The H100 has no such inversion: its Chinese purchase price roughly matches the US, and its cheap rent has other causes: stock machines are mostly partially paid off, and policy risk is discounted into the price.
| China rent | USD/GPU-hour | vs. US | |
|---|---|---|---|
| 8-GPU H100 | RMB 67-68k/month | ~1.6 | 35-55% of US October levels (2.85-4.50) |
| 8-GPU B300 (1-year) | RMB 220-280k/month | ~5.2-6.8 | 80-100% of Silicon Data’s standardized 6.71; 55-70% of Nebius on-demand 9.50 |
Old tiers are cheap because stock machines carry low book value and gray-market assets embed a policy discount; the new tier nears US prices because rent hugs sky-high spot cost. The narrowing China-US spread is itself a record of cost-push inflation.
The inflation chain
Each of the first three links has data:
- Memory: HBM and DRAM contract prices up 4-5x year over year in Q1 2026; DDR5 modules up over 300%; memory’s share of machine cost rose from a tenth to 30-40%.
- Machines: H200 systems rose from RMB 2.1-2.3M to RMB 4.8-5.35M.
- Rent: a broad 30% rise after Lunar New Year; B200 renewals up 94%; Nebius’s October round took H100 to $4.50 and B300 to $9.50, with B300 up 56% cumulative this year.
The last link, token prices, merely coincides in time. DeepSeek’s August adjustment did coincide with B300 marching from RMB 7M toward RMB 14.5M, but that is not causal evidence:
- DeepSeek’s own fleet is not mostly gray-market B300s;
- The official reason is off-peak scheduling;
- Peak input remains below the launch list price.
The safer formulation: competition sets the slope of old-tier deflation, while compute cost sets its floor. In a cycle of widespread tightness and rising cost, even the price cutter has no reason to keep subsidizing.
The output discount: what installed capacity hides
As of June 2026, China’s installed AI compute stands at 2,185 EFLOPS (FP16). The rough model: a typical MoE model needs ~2N floating-point operations per generated token (N = activated parameters). At 40B activated, all-in inference at full peak would theoretically produce ~23 quadrillion tokens a day.
But inference’s normal efficiency is far below peak: ~15% decode utilization × ~70% load ≈ 10%. At 49B activated (matching Section 4’s V4-Pro basis), the national fleet running at normal inference efficiency produces ~200T tokens a day (the conclusion is insensitive to activated parameters in the 40-50B range).
What to use for actual usage returns to Section 1’s definition problem. The official March national figure is 140T; extrapolating top vendors’ roughly 50%-per-quarter growth puts Q3 above 200T. Doubao’s own June figure (180T) is not comparable to the national one and cannot simply be added.
Two readings follow:
- “Overall utilization under 10%” is not evidence of idleness. It is inference’s normal efficiency.
- The real signal is the absence of slack. If the observed figures are credible, the national fleet would have to be almost fully devoted to inference to produce this volume, leaving nothing over for training.
The conversion is precision-sensitive: if inference were universally FP8, effective capacity doubles and the observed share falls to 40-50% (depending on activated parameters and the observed figure). Both sides are coarse (how video tokens are counted, multimodal pricing, and every vendor’s activated parameters differ), so this conversion fixes direction only.
The main evidence is micro:
- High-end card rental utilization above 90%;
- Some machines rented out the day they’re racked;
- New contracts deliver into H1 2027;
- Of B300 listings, only 11% confirmed rentable.
The bottleneck is not installed capacity but effective output. The micro evidence carries that judgment; the macro conversion merely shows the two don’t conflict.
4. Profit: Where the Money Settles
Turn to the profit page and the five links of the value chain read very differently.
| Link | 2026 reading | Source |
|---|---|---|
| Chips (merchant GPUs) | NVIDIA quarterly revenue $96.2B (+106%), 75% gross margin, data center 92% | earnings |
| Chips (custom) | Broadcom AI semis $16.7B/quarter (+221%), ~75% gross margin; guides $115B in 2027, $230B in 2028 | earnings |
| Cloud / self-silicon | Microsoft AI annualized >$37B (+123%); Amazon self-silicon >$20B; Nebius AI cloud 50% EBITDA margin, capacity “sold out on launch” | earnings/letters |
| Independent token factories | SiliconFlow 2025 revenue RMB 55.33M, -24% gross margin (-119% public cloud), RMB 2.9B raised this year to stay alive | funding disclosures |
| Model labs | OpenAI annualized >$40B; Anthropic $30B; Doubao/Qwen usage-billed, Volcano MaaS targeting fivefold revenue | official/estimates |
Profit concentrates heavily in the shovel layer. NVIDIA and Broadcom both run gross margins around 75%; Broadcom’s free-cash-flow margin is 46%. Broadcom’s guidance of doubled 2028 revenue rests on multi-year agreements with six major customers, turning clients’ future demand into the supplier’s revenue visibility, though not yet recognized revenue.
The middle layer is fighting a utility-style price war. The same “independent token factory” model reads opposite in two markets: China’s SiliconFlow buys scale with negative gross margin; overseas, Nebius (with sold-out capacity and $9B of customer prepayments) runs a 50% EBITDA margin. The demand side differs: in China, token price wars cap the rent the middle layer can bear; overseas, customers bid for capacity.
The model labs’ treadmill
Model labs follow a third logic. The chip layer earns current scarcity; the cloud layer earns scale operations; model labs earn capability gaps, and gaps close by themselves. It is a treadmill in four steps:
- A new flagship launches alone in its capability tier, with near-monopoly pricing power.
- Competitors need not match the closed model; open weights or low prices supplying a “good enough” version suffice. GPT-4’s capability was worth $30/M in March 2023; by 2026 the entry price for the same quality is $0.10-0.20, down to 1/150-1/300 in three and a half years. Pressure comes from two sides: open weights supplying the tier near cost, and the giants’ own light tiers pressing down.
- Once a tier is matched, its price collapses toward supply cost. At that price the model lab cannot out-compete clouds and inference platforms, whose floor is their own power and amortization. The only way out is the next flagship, rebuilding the gap.
- The cycle restarts: the old tier collapsing, the new one rising. Stand still and the revenue mix slides into the deflating tiers.
There is a clock on this treadmill: the window during which a new tier holds pricing power: from launch to being matched by a credible low-price substitute.
- GPT-4-class capability: largely matched by open weights in about a year and a half, marked by Llama 3.1 405B in July 2024. GPT-4o mini entering at ~$0.15 the same period corroborates. After the match, prices kept falling for two more years.
- The reasoning tier o1 opened: priced $15/$60 from the September 12, 2024 preview. On January 20, 2025, DeepSeek R1 entered at $0.55/$2.19, input about 1/27 of o1’s. From the preview, about four months; from the December formal API, about five weeks.
The window is visibly shortening. With the clock in view, three phenomena explain themselves:
- GPT-6 Astra vs. GPT-6 Luna: $10/$50 vs. $0.10/$0.50: a hundredfold gap within one company, one generation. That spread is the direct reading of gap pricing.
- Gemini 3.8’s introductory price: the official notice to double at New Year 2027 writes “how much longer can this tier stay scarce” directly into the price list.
- DeepSeek’s August adjustment: three forces at once: clawing back subsidy, scheduling congestion, and a window with no rival yet on the V4-Pro tier. The data cannot split their shares.
So the frontier premium is not greed; it is maintenance, paying the next training run’s bill. And it cannot cover the bill. Anthropic’s $30B annualized revenue faces nearly 10 GW of 2027 commitments. At roughly ten billion dollars per GW-year of renting, full build-out means hundred-billion-dollar annual outlays; even phased, 2027 alone runs tens to hundreds of billions. Revenue won’t cover it; the gap is financed: the other face of the “financialization of capacity” at the end of this section.
The sharpest single indicator of a model lab’s ledger health is not revenue growth but which deadline arrives first: the pricing window of its new flagship, or its financing window.
Two ways to sell: by token, or by card
Everyone in this ledger sorts into two bins by what they sell:
- Selling tokens: usage-billed APIs, subscription-bundled MaaS;
- Selling compute: hourly, monthly, bare-metal long leases, GW-scale contracts.
The two differ sharply in scale and trajectory. China’s numbers:
- Compute rental (per-card monthly): Q1 2026 at RMB 68B, +62% YoY (CAICT basis). CITIC Construction and others project the full year above RMB 260B. That projection conflicts with Q1’s annualized RMB 272B; at +62%, the year should land well above 260B; most full-year forecasts were made early and may not have been updated.
- MaaS (per-token billing): no official total; it must be estimated. Volcano Engine holds 49.5% of public-cloud MaaS volume (verified as token-volume share). Scaling Volcano’s revenue band (this article’s RMB 15-25B estimate) puts the national market around RMB 30-50B. Volcano prices below industry average, so this is a lower bound.
The two definitions overlap: MaaS providers also rent cards, and rental revenue embeds token-side costs. So their ratio is a scale comparison, not a decomposition of end spending. With that caveat: money collected per-card is at most 5-9x money collected per-token today.
The token side is growing triple digits: Alibaba’s AI-related revenue has run twelve consecutive triple-digit quarters; Doubao usage grew tenfold in a year. The card side grew 62% in Q1, and agency full-year forecasts are more conservative. The token share rises every year. Alibaba’s management has said the direction plainly: MaaS will become Alibaba Cloud’s largest revenue product.
The boundary between the two ways of selling is moving in both directions:
- Compute vendors are integrating forward. The lessor Runjian has publicly repositioned around a “token factory” model; Shenzhen hosts distribution platforms that buy hardware, deploy open models, sell tokens globally, and take a 2-5% cut; Nebius lists high-margin “Token Factory” as an asset-light new business. The reason: token prices embed compute cost; only by standing on the token side do you capture the density dividend.
- Heavy users are exiting in reverse. In IDC’s June survey, 85% of enterprises said they need hybrid deployment. Per-token billing means “the more you use, the more you pay”; once the token bill exceeds the amortization of self-owned gear, enterprises step back to buying compute, or building.
The two modes will not replace each other: the token side eats density growth; the card side eats capex. Subscriptions, usage billing, cache discounts, and capacity blocks are stitching both into one price list.
For reading ledgers, the practical use: to judge a company’s profit quality, first ask which side it collects on. The token side’s margin is set by capability gaps (the treadmill); the card side’s by depreciation mismatch and utilization (the two-track market); the two differ outright in accounting character. When “token factory” gets thrown around, one question, “are you selling tokens or cards?”, clears most of the fog.
Margins across five business models
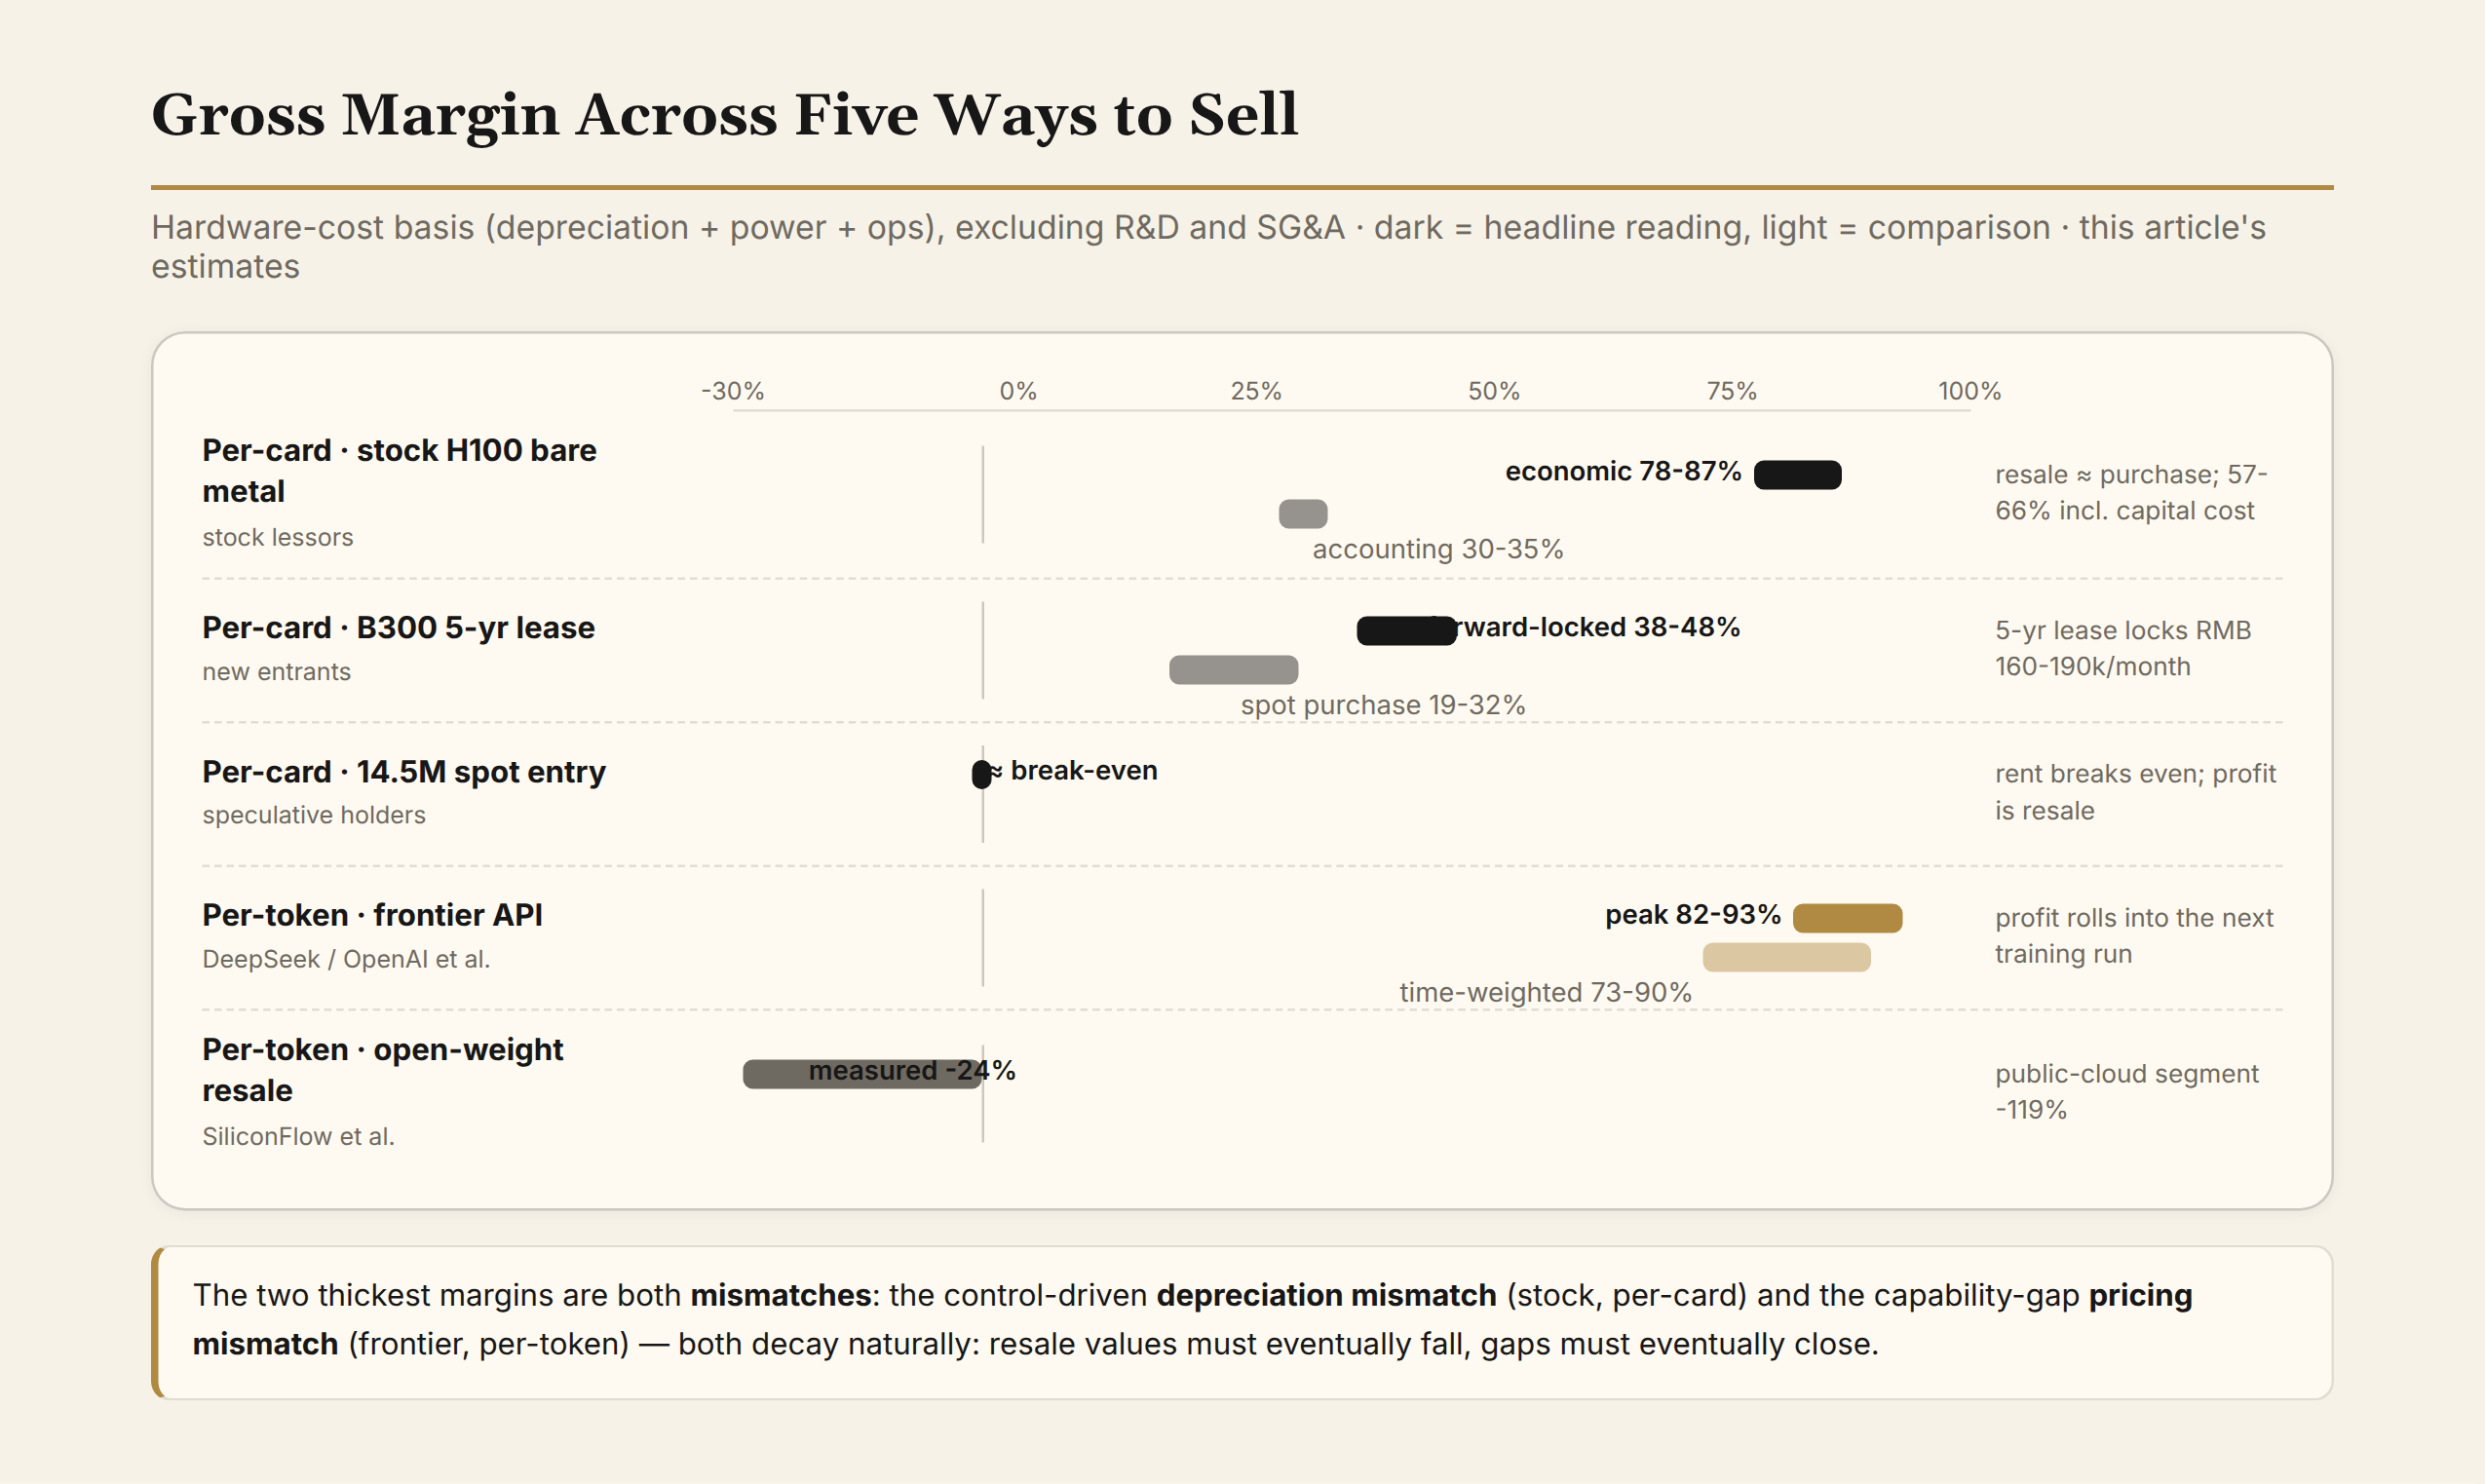
With the selling modes fixed, margins can be measured. The table works five typical books, all this article’s estimates with assumptions attached. “Margin” is on a hardware basis: depreciation, power, and ops only, no R&D, sales, or G&A.
| Model | Typical player | Monthly revenue | Full cost | Margin |
|---|---|---|---|---|
| Per-card · stock H100 bare metal | stock lessors | RMB 67-68k/machine | accounting RMB 44-47k (5-yr straight-line + power + ops); economic RMB 9-15k (power/ops ~9k + realized depreciation 0-6k) | accounting 30-35%; economic 78-87%; 57-66% including capital cost |
| Per-card · B300 5-yr lease | new entrants | RMB 160-190k/machine | forward-locked basis RMB 99k; spot (RMB 7.0M) basis RMB 129k | forward 38-48%; spot 19-32% |
| Per-card · RMB 14.5M spot entry | speculative holders | ~RMB 250k/machine | amortization 242k + power/ops 12k | roughly break-even: renting out doesn’t pay; the profit is resale |
| Per-token · frontier API | DeepSeek/OpenAI et al. | V4-Pro blended (3:1): peak $1.98/M, off-peak $0.99; time-weighted ~$1.3-1.45 | hardware serving cost ~$0.14-0.35/M | peak 82-93%; off-peak 65-86%; weighted 73-90%. Profit rolls into the next training run |
| Per-token · open-weight resale | SiliconFlow et al. | n/a | rented compute is 87% of cost of sales | measured -24% (public cloud -119%) |
Table notes:
- H100 economic basis: realized depreciation = (purchase − resale) ÷ ~34 months used. Capital cost at a RMB 2.1M market value and 8% annual is ~RMB 14k/month.
- Frontier-API time weighting: peak is ~21% of the week but covers Beijing working hours, so the blend assumes peak carries 30-45% of volume. With cache hits, realized price falls further.
- Serving-cost assumptions: 8-GPU B300, FP8 dense ~4.5 PFLOPS per card, 49B activated, 15% decode utilization, 70% load, ~100B tokens per machine-month. Full monthly cost by purchase basis: RMB 99-254k; at RMB 5.2-7.0M purchase, serving cost is ~$0.14-0.18/M; rebuilt at RMB 14.5M spot, ~$0.35/M; FP8→FP16 doubles it.
- Serving-cost limits: the estimate does not separate prefill (much cheaper per unit) from decode, which is conservative for a 3:1 blend. It is a marginal-cost sketch of rebuilding a fleet at today’s prices, not DeepSeek’s actual cost; their fleet is not gray-market B300s.
The price list itself discloses the cost structure (same-source corroboration below; it shares throughput assumptions with the table and is not an independent check):
- Peak/off-peak spread: every tier’s peak price is exactly 2x its off-peak: time-based price discrimination.
- Cache spread: the cache-hit price is 1/50 (V4.1-Flash) to 1/30 (V4-Pro) of the same-window miss price. Prefix reuse consumes almost no compute, and the price list prices it that way. Cache prices rose with the August adjustment (Pro peak now $0.044), but against the same-window miss price the discount remains more than an order of magnitude.
- Flash’s off-peak price: V4.1-Flash’s off-peak input of $0.15/M sits at the lower bound of the serving cost implied by V4-Pro’s scale. V4.1-Flash’s model card lists activated parameters of 8B at prefill and 16B at decode (552B backbone plus 196B Engram conditional memory), with decode at less than half of V4-Pro’s 49B, so its true serving cost should be lower still; off-peak pricing is at least not loss-leader behavior. But this rests on this article’s cost assumptions and is not settled fact.
DeepSeek has effectively laid the structure before the market: reuse is nearly free, fresh compute prices near cost, and the profit loads on peak hours and output.
The frontier tier’s thick margin mostly exists after the repricing. At the pre-August blended price (~$0.54), hardware margin was only ~35-74%, hardly profiteering.
The ordering of this table is itself the judgment:
- The two thickest margins are exactly the two mismatches: the control-driven depreciation mismatch (stock, per-card) and the capability-gap pricing mismatch (frontier, per-token).
- The thinnest two: matched open-weight resale, and incremental buyers who entered at spot prices.
Both thick margins decay naturally: resale values must eventually fall; gaps must eventually close. The stock per-card players and the per-token model labs stand on the same treadmill, facing opposite directions: one waiting for asset depreciation to catch up with rent, the other waiting for open weights to catch up with the flagship.
Pricing power: the anchor sits with the model labs
The table raises a question the per-token rows force: who holds pricing power? The empirical answer is strikingly clean: the model labs. The same open-weight model hosted by many vendors does not loosen the official price’s anchor role.
- SiliconFlow’s price list: DeepSeek-V4-Pro-0813 at $1.32/$3.96, to the cent the official peak price; V4.1-Flash at $0.15/$0.60, effectively adopting the official off-peak as the standing price.
- TRAE’s adjustment notice: says it outright: “due to DeepSeek’s official pricing adjustment,” input raised to about 3x.
- The R1 era: Huawei Cloud and SiliconFlow announced “same as official” on day one, competing on speed (faster when the official API is congested), not price.
Two mechanisms must be kept apart:
- Open weights erode pricing power between tiers (the treadmill above): open weights match the old tier and collapse its price.
- Within one model, openness has not changed the official price’s anchor status. Price above the anchor and users go official; below it and margin hits zero. Pinned at both ends, following the official price is the only equilibrium.
That is also the micro-mechanism of the resale row’s negative margin: SiliconFlow pins its price to the anchor while renting compute at above-anchor cost.
Third-party token factories are spread businesses: margin = anchor price − own cost, and neither end is theirs.
- The anchor is set by the model lab’s capability gap and cost curve. DeepSeek’s documentation already promises that once Ascend 950 supernodes ship at scale, V4-Pro will be “substantially reduced.” Even the anchor’s direction is written into the model lab’s own hardware procurement plan.
- Own cost is set by the hardware cycle.
When the anchor moves, followers’ margins redistribute instantly: August’s official adjustment widened the margin of everyone pinned to it; the post-Ascend-950 official cut is the next squeeze. The model labs’ treadmill pace is simultaneously the third parties’ margin calendar.
What’s left for third parties is service: faster and more stable at the same price, or leaving resale altogether for private deployment and enterprise SLAs.
Buyers’ capital structure
The buyers’ balance sheets are deforming too:
- Anthropic’s IPO materials disclose up to $42B of financing from Broadcom backing five-year TPU leases. Compute procurement is starting to resemble long-term power purchase agreements.
- OpenAI’s compute grew from 0.6 GW in 2024 to 1.9 GW in 2025.
- Amazon is exploring moving $8B of NVIDIA chips off its balance sheet.
- The four hyperscalers’ 2026 capex guidance totals $733B (+79%).
Supply-side GW promises, demand-side multi-year leases, plus financing arrangements; capacity is being financialized.
5. The Cycle: 2027 Utilization Will Deliver the Verdict
The most uncertain page of this ledger is where the cycle sits.
The bulls have specific evidence:
- Nebius said at its price increase that demand visibility exceeds 24 months, with customers already booking H1 2028 capacity.
- H100 rent bottomed at $1.70 in October 2025, recovered to $2.35 in March 2026, and reached $2.85-4.50 by October. The V-shape at least says the previous “oversupply” liquidation is complete.
- China’s in-force compute contract values keep being revised up; Xingyun Technology’s three contracts were raised 201%, 79%, and 13%.
The bears’ evidence is equally specific:
- B300 spot quotes sit 30-60% above lease-and-channel-based value and 50% to over 2x above throughput-based value (Section 3): mostly panic and channel premium.
- Broadcom’s $230B 2028 revenue guidance discounts 20 GW of unbuilt capacity into current expectations and valuations.
- GW-scale capacity lands in a 2027 cluster; Anthropic alone approaches 10 GW. If it meets slowing demand growth, the rent curve can borrow H100’s own history: about two years from a ~$8 peak (2023) to $1.70 (October 2025).
One variable will adjudicate: utilization when the 2027 delivery wave lands. It is the first-hand evidence on “token-factory glut or shortage,” harder than any analyst’s call. Until then, four leading indicators are worth tracking:
- Silicon Data’s LLM token-spend index: the October 9 reading rose 4.9% in a week, independent evidence of token-side price movement.
- Frontier flagship renewals: the speed of the capability treadmill.
- The B300 spot-vs-forward spread: the thermometer of channel panic.
- Domestic accelerator shipments: RMB 40-80k per card for “near-H100 inference”: China’s hole card for fighting a token price war under scarcity.
Conclusion
Three judgments carry this ledger.
First, “usage is exploding” is three factors stacked, and must be unpacked before reading. The most underrated is density: reasoning, agents, and video have raised per-task token consumption by one to two orders of magnitude. It is the demand side’s most genuine growth, and it inherently distorts every token-denominated historical series. Almost as underrated is the share of internal consumption: Volcano’s externally billed volume is about a tenth of Doubao’s total, and revenue captured only part of the growth. The industry needs a fixed task basket; until one exists, every “thousand-fold” should be read at a discount.
Second, margin will not be delivered automatically by technical progress. Same-tier prices fall about 4-5x a year while NVIDIA’s hardware energy efficiency improves ~2.7x annualized, and hardware unit costs actually rose in 2026 (Section 3). Price decline is carried by algorithmic efficiency (smaller models reaching equal capability) stacked on hardware iteration; the residual lands on margins. The comparison is qualitative: competition and utilization decide who fills the gap. Those who can, survive: sold-out clouds, ecosystem giants, craft inference platforms. Those who can’t, exit: negative-margin independents. The cost-upcycle has raised the floor; old-tier deflation and frontier firmness are two pages of one ledger.
Third, profit currently settles in the shovel layer and in a few positions holding scarce stock or capability gaps; China’s middle layer is turning into a utility business. The structure’s weak point is not demand (24-month visibility) nor supply (the delivery wave arrives in 2027) but the financing structure. Top model labs’ compute commitments already run to multiples of revenue; buyers lease-and-finance their capacity; sellers discount 2028 GW into guidance and valuation. The whole chain’s solvency rests on one assumption: that token revenue compounds on schedule. The 2027 utilization number will be this ledger’s first true audit.
Notes on data and definitions
Primary official sources: Doubao usage series (four Volcano Engine disclosures); Google token series (I/O 2026 keynote); Gartner AI-optimized IaaS basis (2026-08-10 press release; inference $23.3B ≈ 55% of that pool); NVIDIA, Broadcom, Nebius, Alibaba earnings (Alibaba June 2026 quarter: AI-related product revenue RMB 12.4B, twelfth consecutive triple-digit quarter, SEC 6-K release); OpenAI enterprise report; DeepSeek/Alibaba/Volcano pricing pages and announcements (peak/off-peak windows and the September 2026 V4.1-Flash release per the official pricing page; V4.1-Flash activated parameters cross-checked via NVIDIA’s official HF model card and vLLM docs); Silicon Data index (Oct 9); Nebius price-increase notices; CAICT installed-capacity figures; EIA power prices; o1 pricing (OpenAI announcement, 2024-09-12); Llama 3.1 405B release date (Meta blog, 2024-07-23); H800/H100 system purchase contract prices (Lianhua Keji announcement; China Telecom tender, transcribed public notice); Gemini 2.5 Flash token-usage measurement (Artificial Analysis, 2025-05; the 17x is reasoning-on against the previous non-reasoning generation).
Authoritative transcriptions (B): compute-rental expert calls and industry surveys (Sina Finance, Chenjian Cloud, SMM); H100/B300 rent indices (SemiAnalysis); B300 price timeline (Kuaitech, Leiphone, EET-China, multi-source); SiliconFlow financials (funding disclosure via Qianbidao); Anthropic/Broadcom IPO materials (Reuters); State of AI Report 2026.
This article’s estimates (D, assumptions attached):
- Volcano MaaS implied revenue and realized price: 2025 externally billed 1,944T × 49.5% ≈ 960T (composition inferred) → 2026 external ×10 → 9.6 quadrillion → RMB 15-25B → implied RMB 1.6-2.6/M; back out 2025 at RMB 3-5. “Price halves” follows from two assumptions, not an independent check.
- National installed-capacity implied utilization: 2N ops per token; at 49B activated, 15% decode utilization × 70% load ≈ 10% → ~200T/day; sensitive to FP16/FP8 and to activated parameters in the 40-50B range.
- 10k-cluster power: 10 kW × 1,250 machines × PUE 1.0-1.3 = 110-140M kWh; the media-circulated “600M kWh/year” is inconsistent with these assumptions and not used.
- H100/B300 full cost and IRR: monthly cash-flow discounting, fully leased, zero residual, excluding vacancy, taxes, financing.
- Frontier-API weighted realized price: peak load share assumed 30-45%.
- Anthropic 10 GW outlay: order-of-magnitude ~$10B per GW-year of renting.
- Price-slope annualization: ~4-5x over 3.5 years; window-sensitive.
Known weak points:
- October domestic B300 rent of RMB 220-280k/month is a trend band (July survey at RMB 250k plus multi-source forecasts), not a same-day reading.
- B300 RMB 13-14.5M is verbal channel quotation; actual transaction volumes cannot be audited, treated as a “high quote band.”
- No systematic data exists for a “fixed task basket”; density inflation is argued from indirect evidence, and OpenAI’s 320x mainly reflects reasoning-model adoption.
- OpenAI’s September “approaching $70B” was unconfirmed and since corrected; this article anchors on August’s $40B.
- Matching GPT-4-class quality to a price involves subjective tiering; the multiple is computed as 1/150-1/300 under the industry-standard fixed-capability convention.
- The Volcano MaaS revenue estimate’s top end is a management target, not realized revenue; “fivefold” can mean ×5 or ×6.
- Alibaba’s “AI models and applications” guidance (RMB 30B) and “AI-related product revenue” (RMB 12.4B in the June quarter) differ in definition; the correspondence has not been disclosed.